

The Customer Behaviour Analysis Playbook
A roadmap of foundational product analyses for your business, including open-source templates that can be adapted to your data.

This is Part 3 of a series on core principles for becoming data-driven in Product & Growth:
Audit your customer journey to uncover growth opportunities.
Sharpen your vision of the ideal customer experience with advanced analytics.
Simulate the outcomes of growth initiatives through scenario and sensitivity analysis.
Measure the business outcomes of your growth initiatives post-released.
Discover more about who we are and our mission in our Manifesto.
What’s in it for you
From the customer journey audit, we have identified drop-offs and friction points, which serve as excellent starting points for evaluating which areas of the product experience require the most attention.
To gain a comprehensive understanding of how to further optimise it, you should analyse the behaviours of your most successful users and understand how they differ from those who don't persist.
As you collect tracking events data in your product, it's easy to feel overwhelmed with how to effectively leverage them to extract meaningful insights. With this post, our aim is to offer you a structured approach to analysing user behaviours throughout each stage of their lifecycle.
After reading this piece, you will have a roadmap of foundational analyses for your business. In the following posts, we will share open-source templates that can be adapted to work with your product usage data.
Getting started
We will illustrate our methodology using Miro as an example, taking on the role of the first Product Analysts in the company, assuming they don’t have advanced Product insights yet. Our approach in this post will be applied to B2B Product Analytics, although the overall framework and thought process also works in the B2C realm.
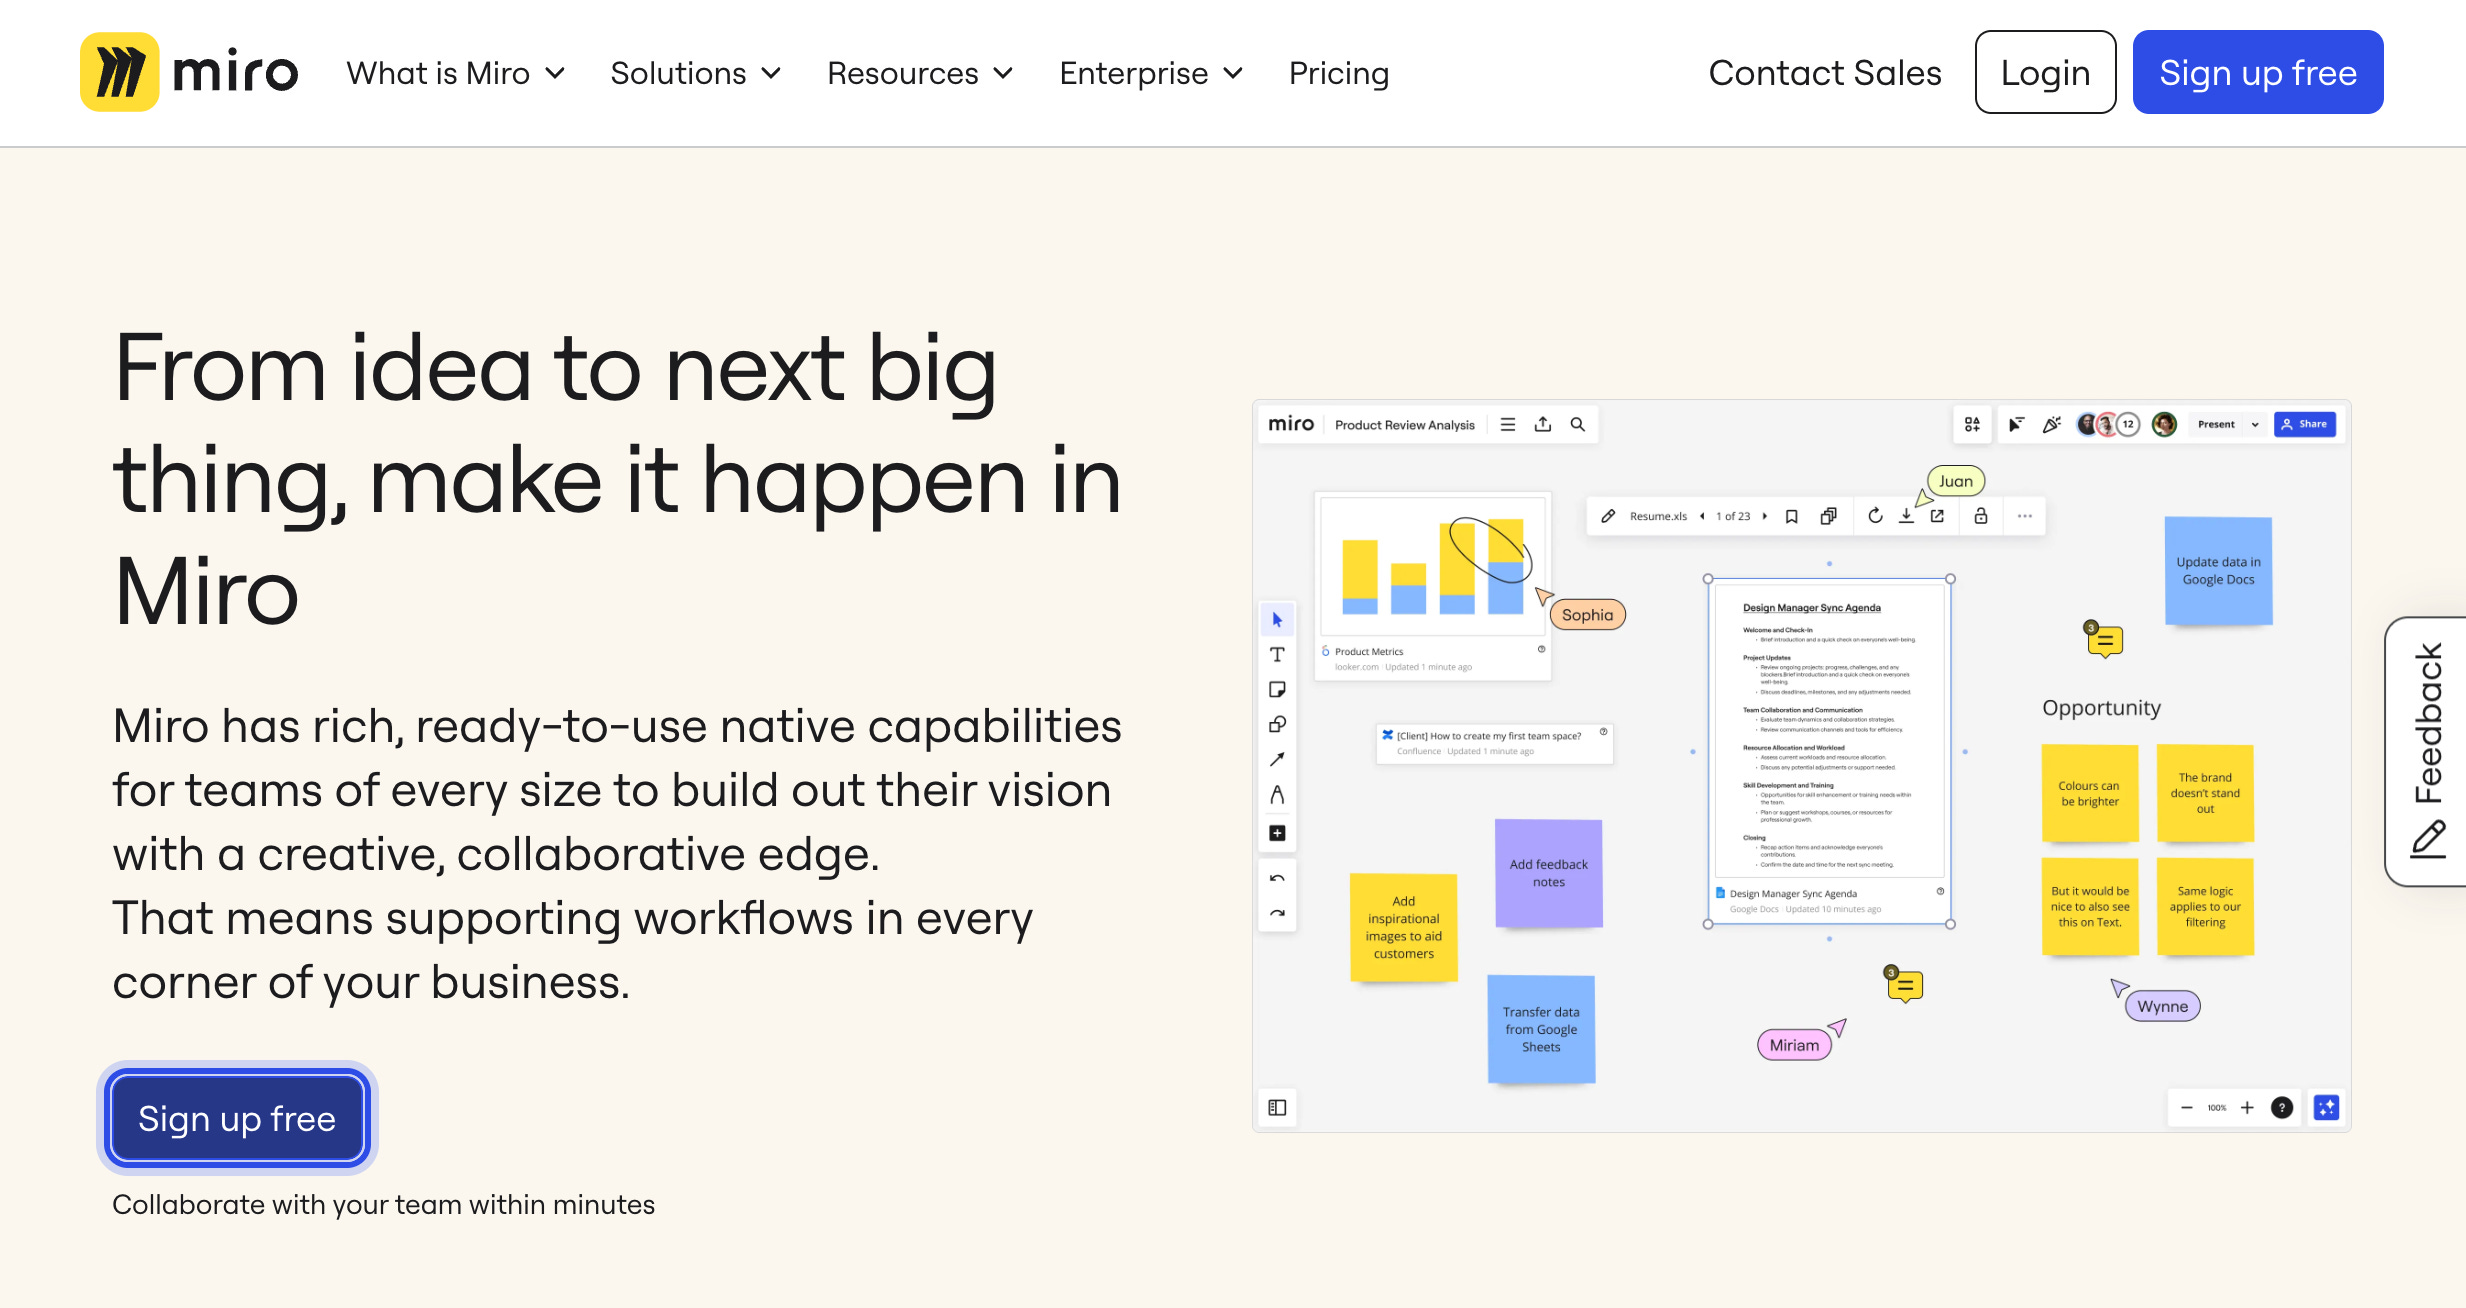
Miro is an online collaborative whiteboard platform that enables teams to ideate, brainstorm, and collaborate visually in real-time. It offers a digital canvas where users can create and share diagrams, mind maps, wireframes, sticky notes, and more.
🔔 Throughout the upcoming sections, we'll share metrics and benchmarks. Please note that these are not reflective of Miro’s actual data and are provided as dummy values to enhance the case study's clarity.
Connecting Customer Behaviours to Revenue
At Growth Science, our focus is on aligning product analytics with tangible business outcomes. Before diving into customer behaviour data, it's crucial to grasp how product analyses can directly impact Miro's revenue generation process and key levers.
Miro’s revenue architecture
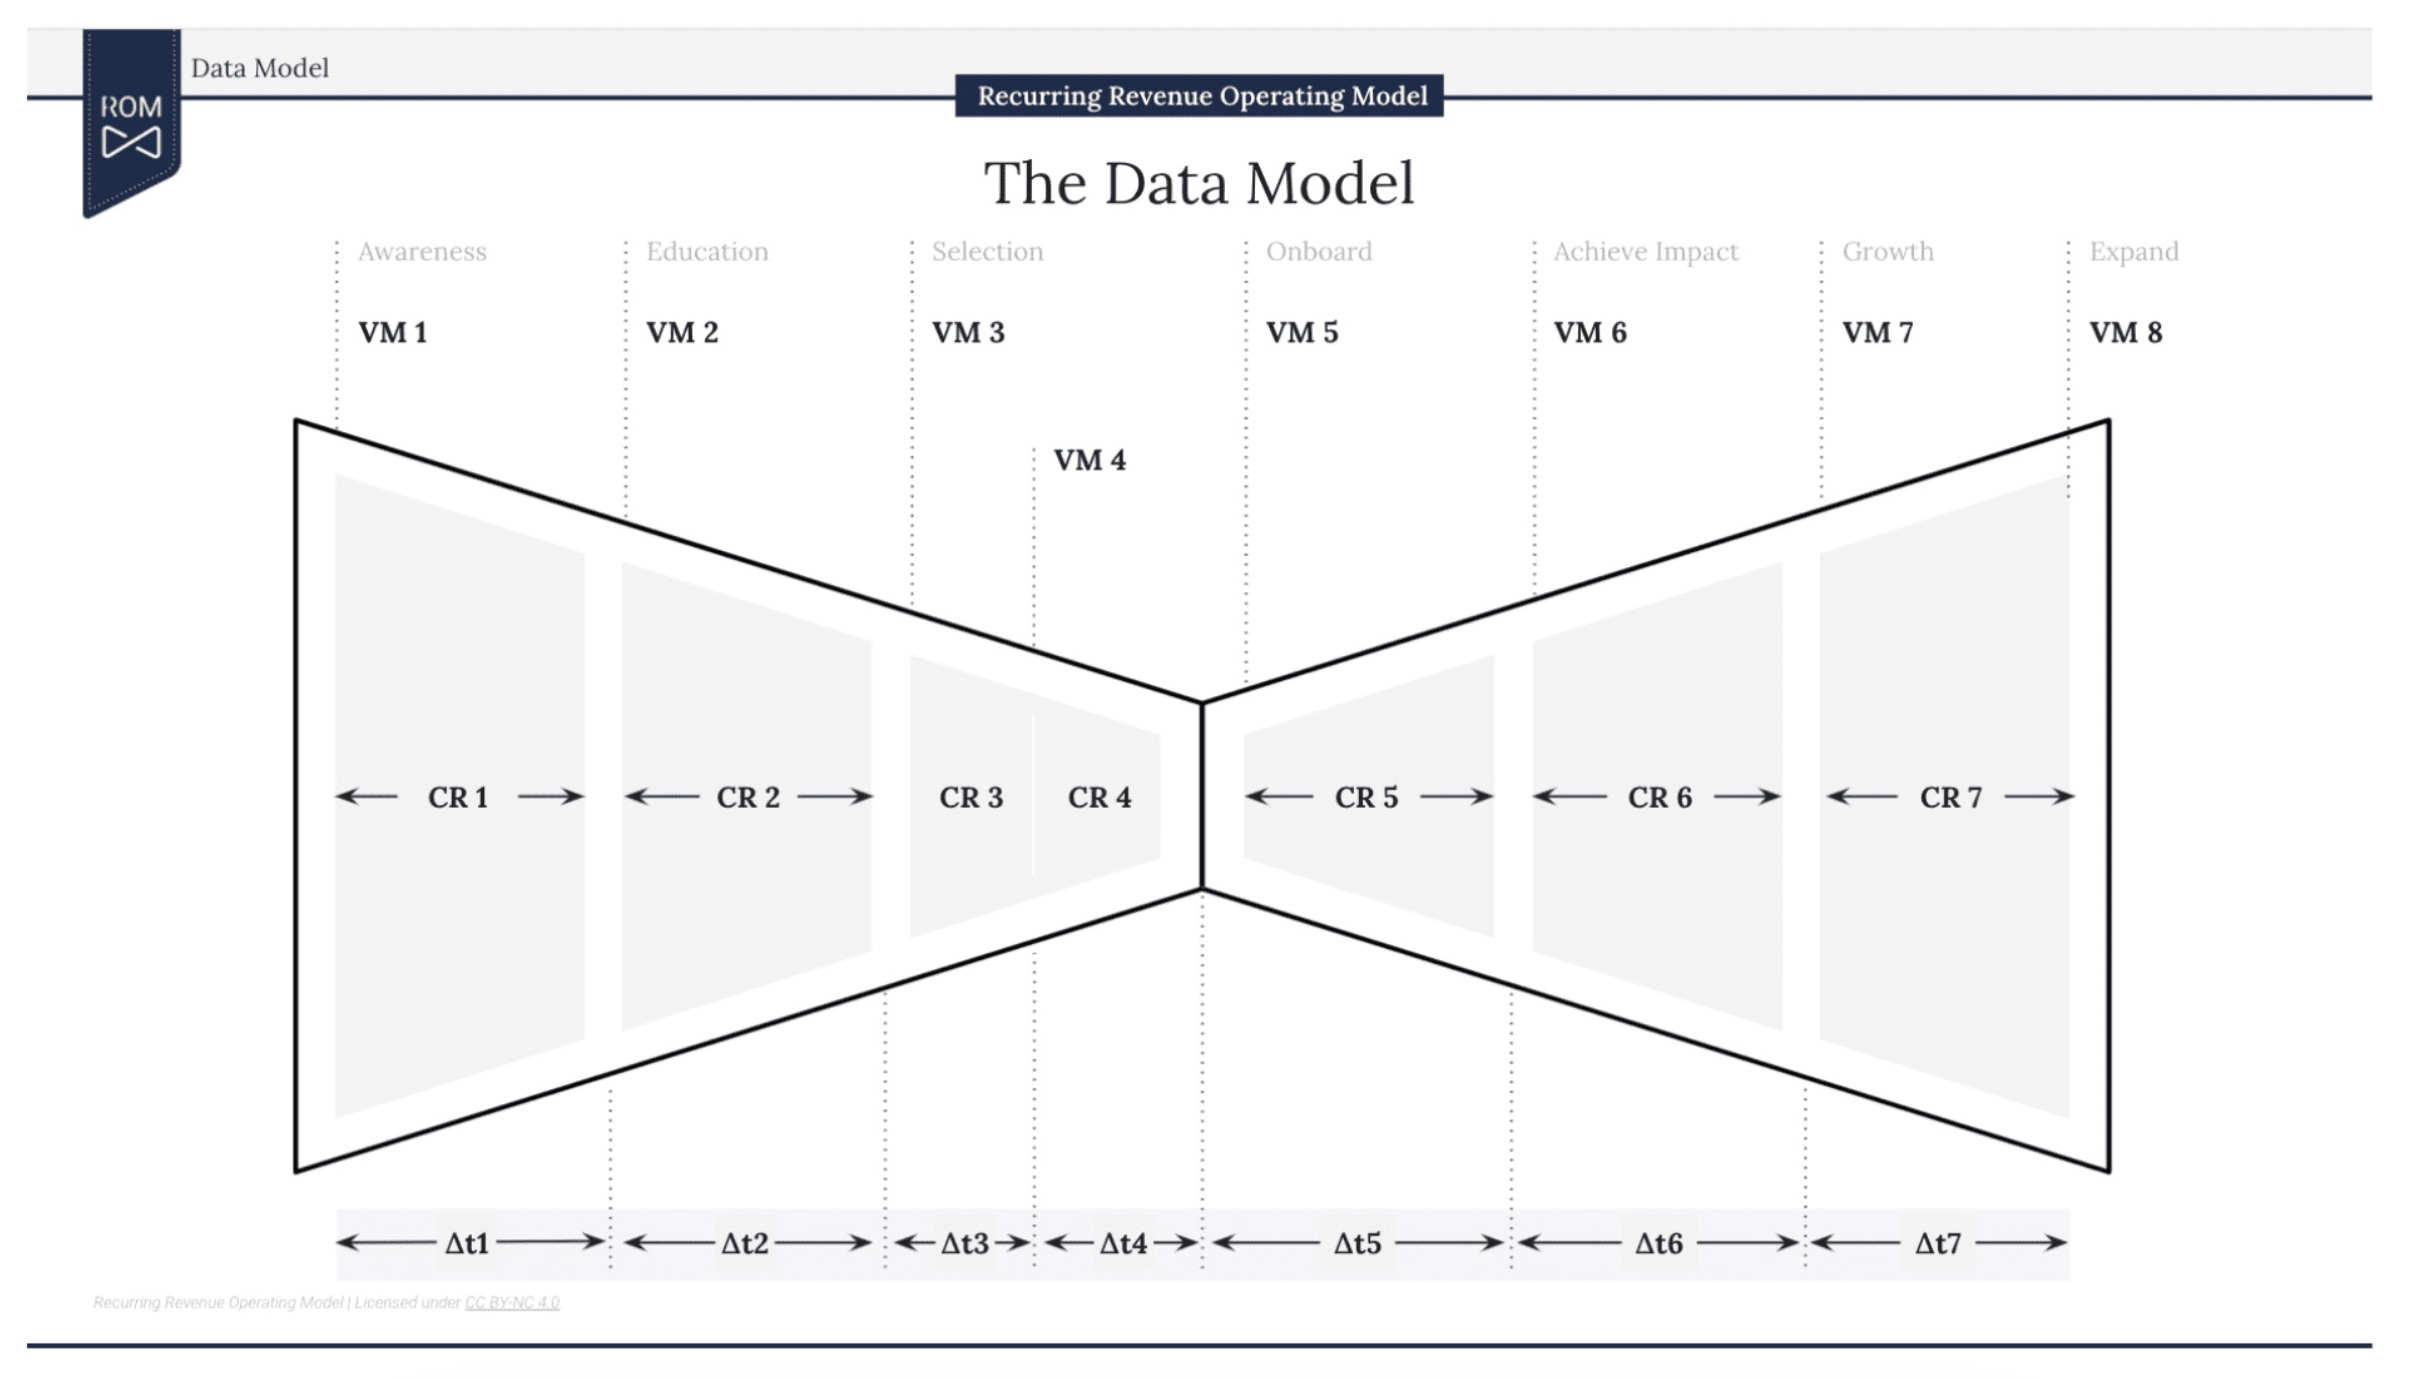
Similarly as other B2B Businesses with recurring revenue, Miro falls under the bowtie model, popularised by Winning by Design. The total revenue generated is composed of two funnels, a process to sell (new $ARR) and a process to retain/expand (repeat $ARR).
Going one step further, we can infer from Miro’s pricing page that they operate through two primary revenue generation channels, constituting their total $ARR:
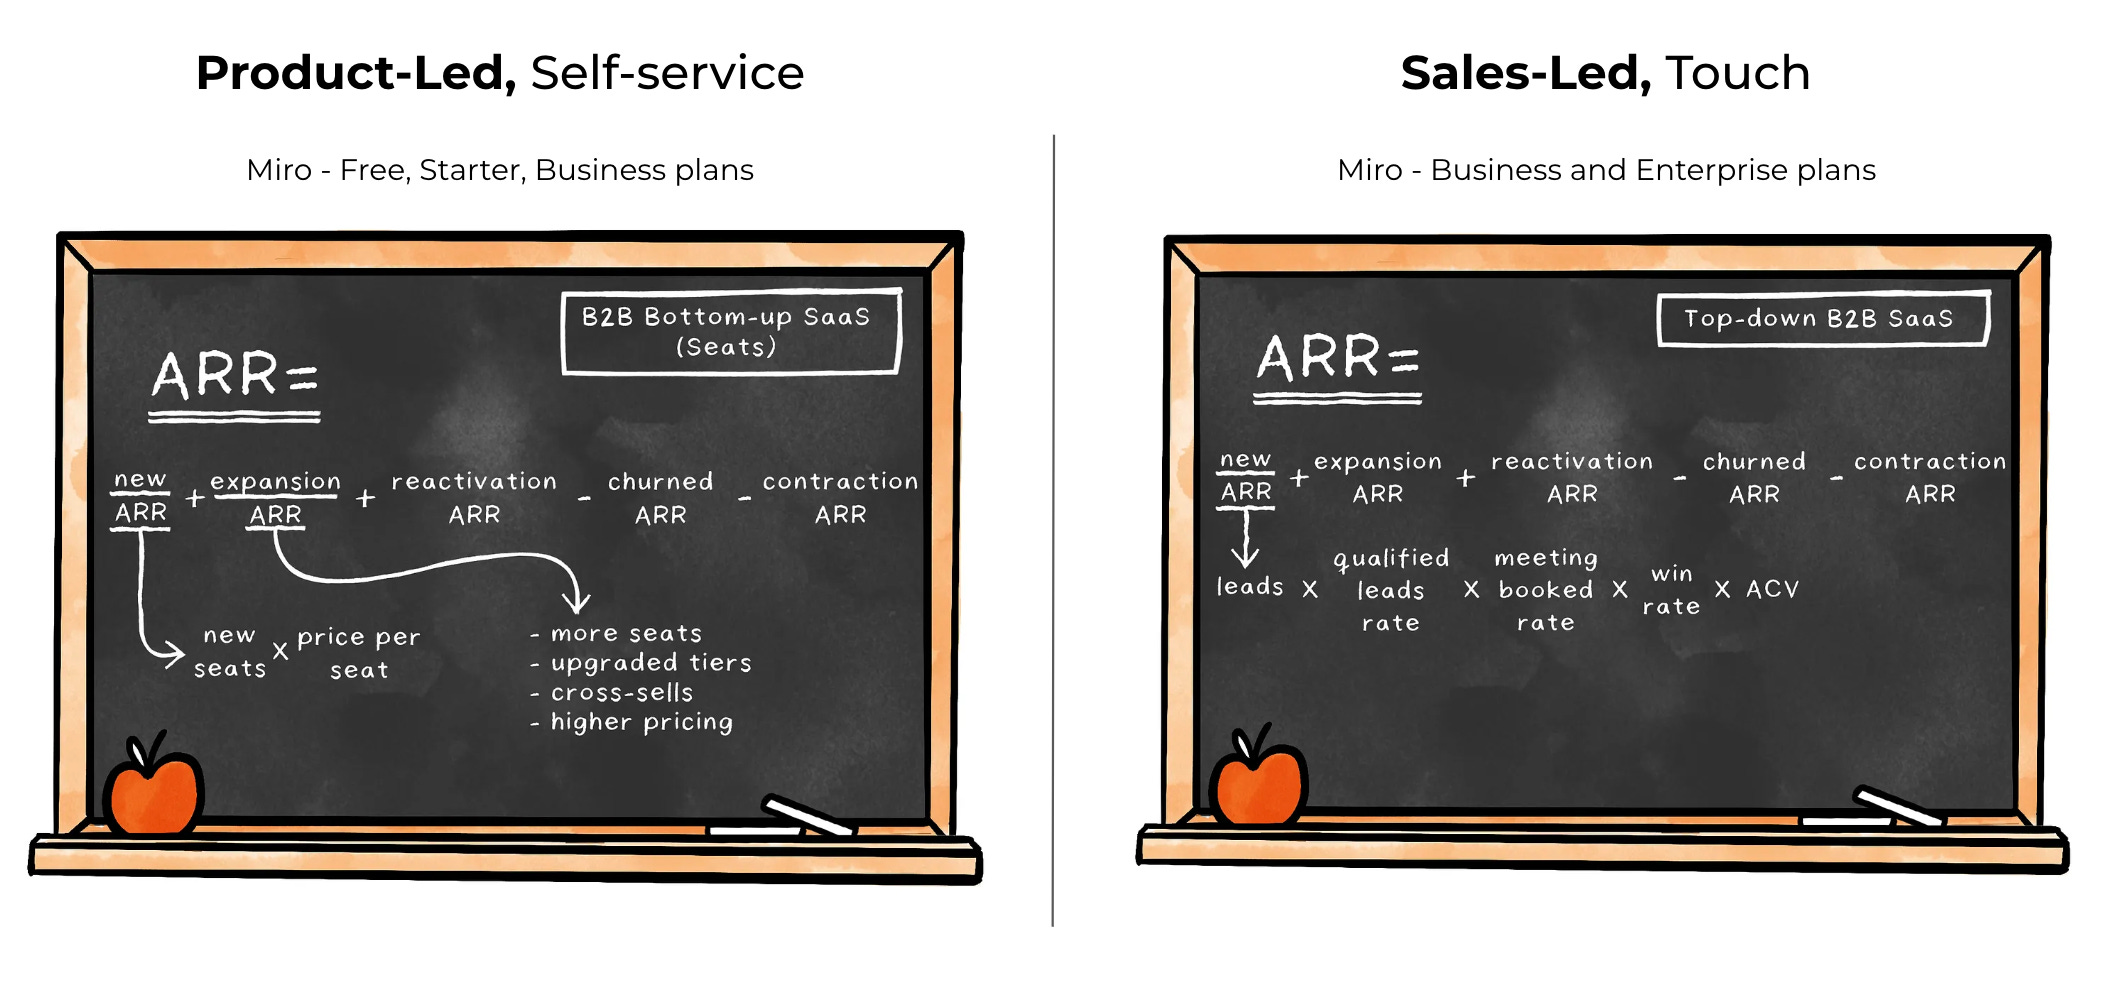
Unbundling Miro’s $ARR equation
How can we as operators influence the different components of $ARR?
While the revenue formula perspective is actionable for executives and management at their altitude, our challenge lies in translating these metrics into operational objectives that teams can pursue in their day-to-day activities.
To achieve this, we need to dive deeper into how Miro acquires new customers and retains/expands them over time. This involves gaining a clear understanding of:
The customer buying process
The product adoption journey
The roles and motivations of the individuals involved in these processes.
Identifying the personas involved in the buying and adoption journeys
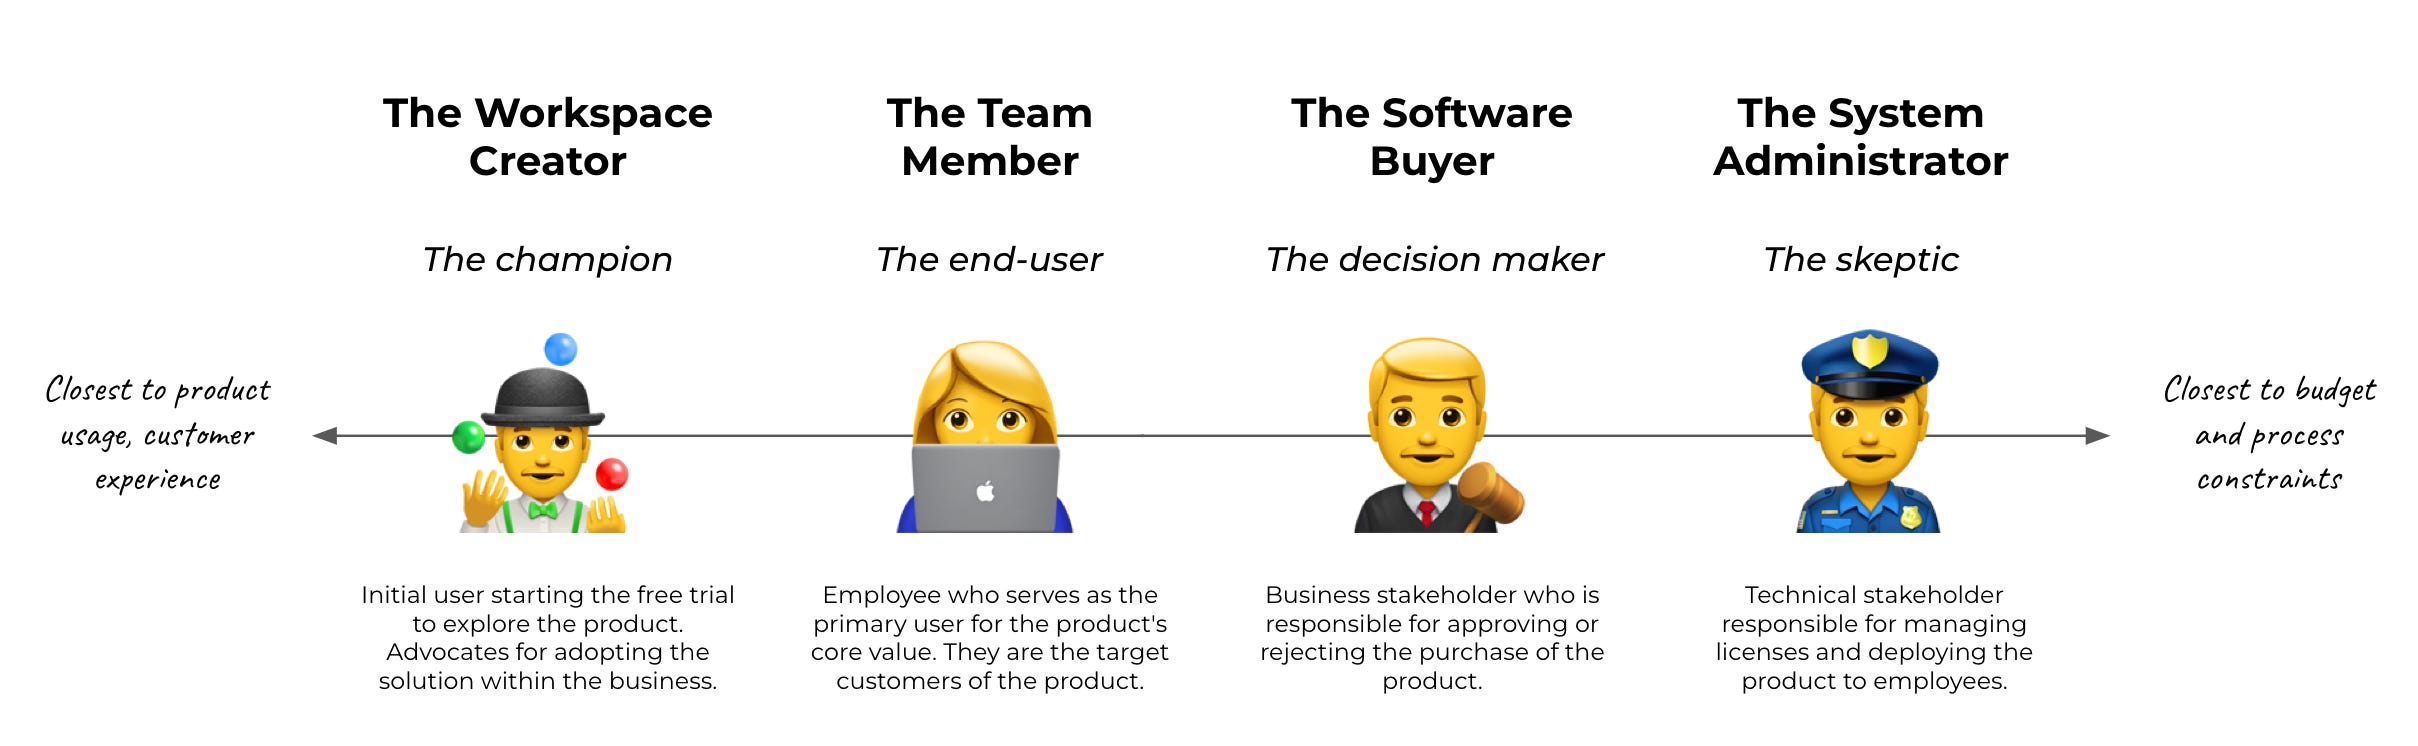
Understanding pivotal milestones and behaviours for a B2B product can be more intricate compared to the B2C world. This complexity stems from the involvement of multiple personas, each with unique goals and motivations, at various stages of the journey.
Depending on the target customer company's size and sophistication, roles and motivations may be concentrated in one individual or dispersed among several stakeholders.
Mapping the buying and product adoption journey
The buying and adoption journey for B2B products are much more complex than a simple five-step funnel, which typically includes visiting the website, signing up for a trial, trying the product, making a purchase, and engaging with it.
For Miro, given its seat-based recurring revenue business model, we anticipate the buying and adoption processes to unfold as follows:
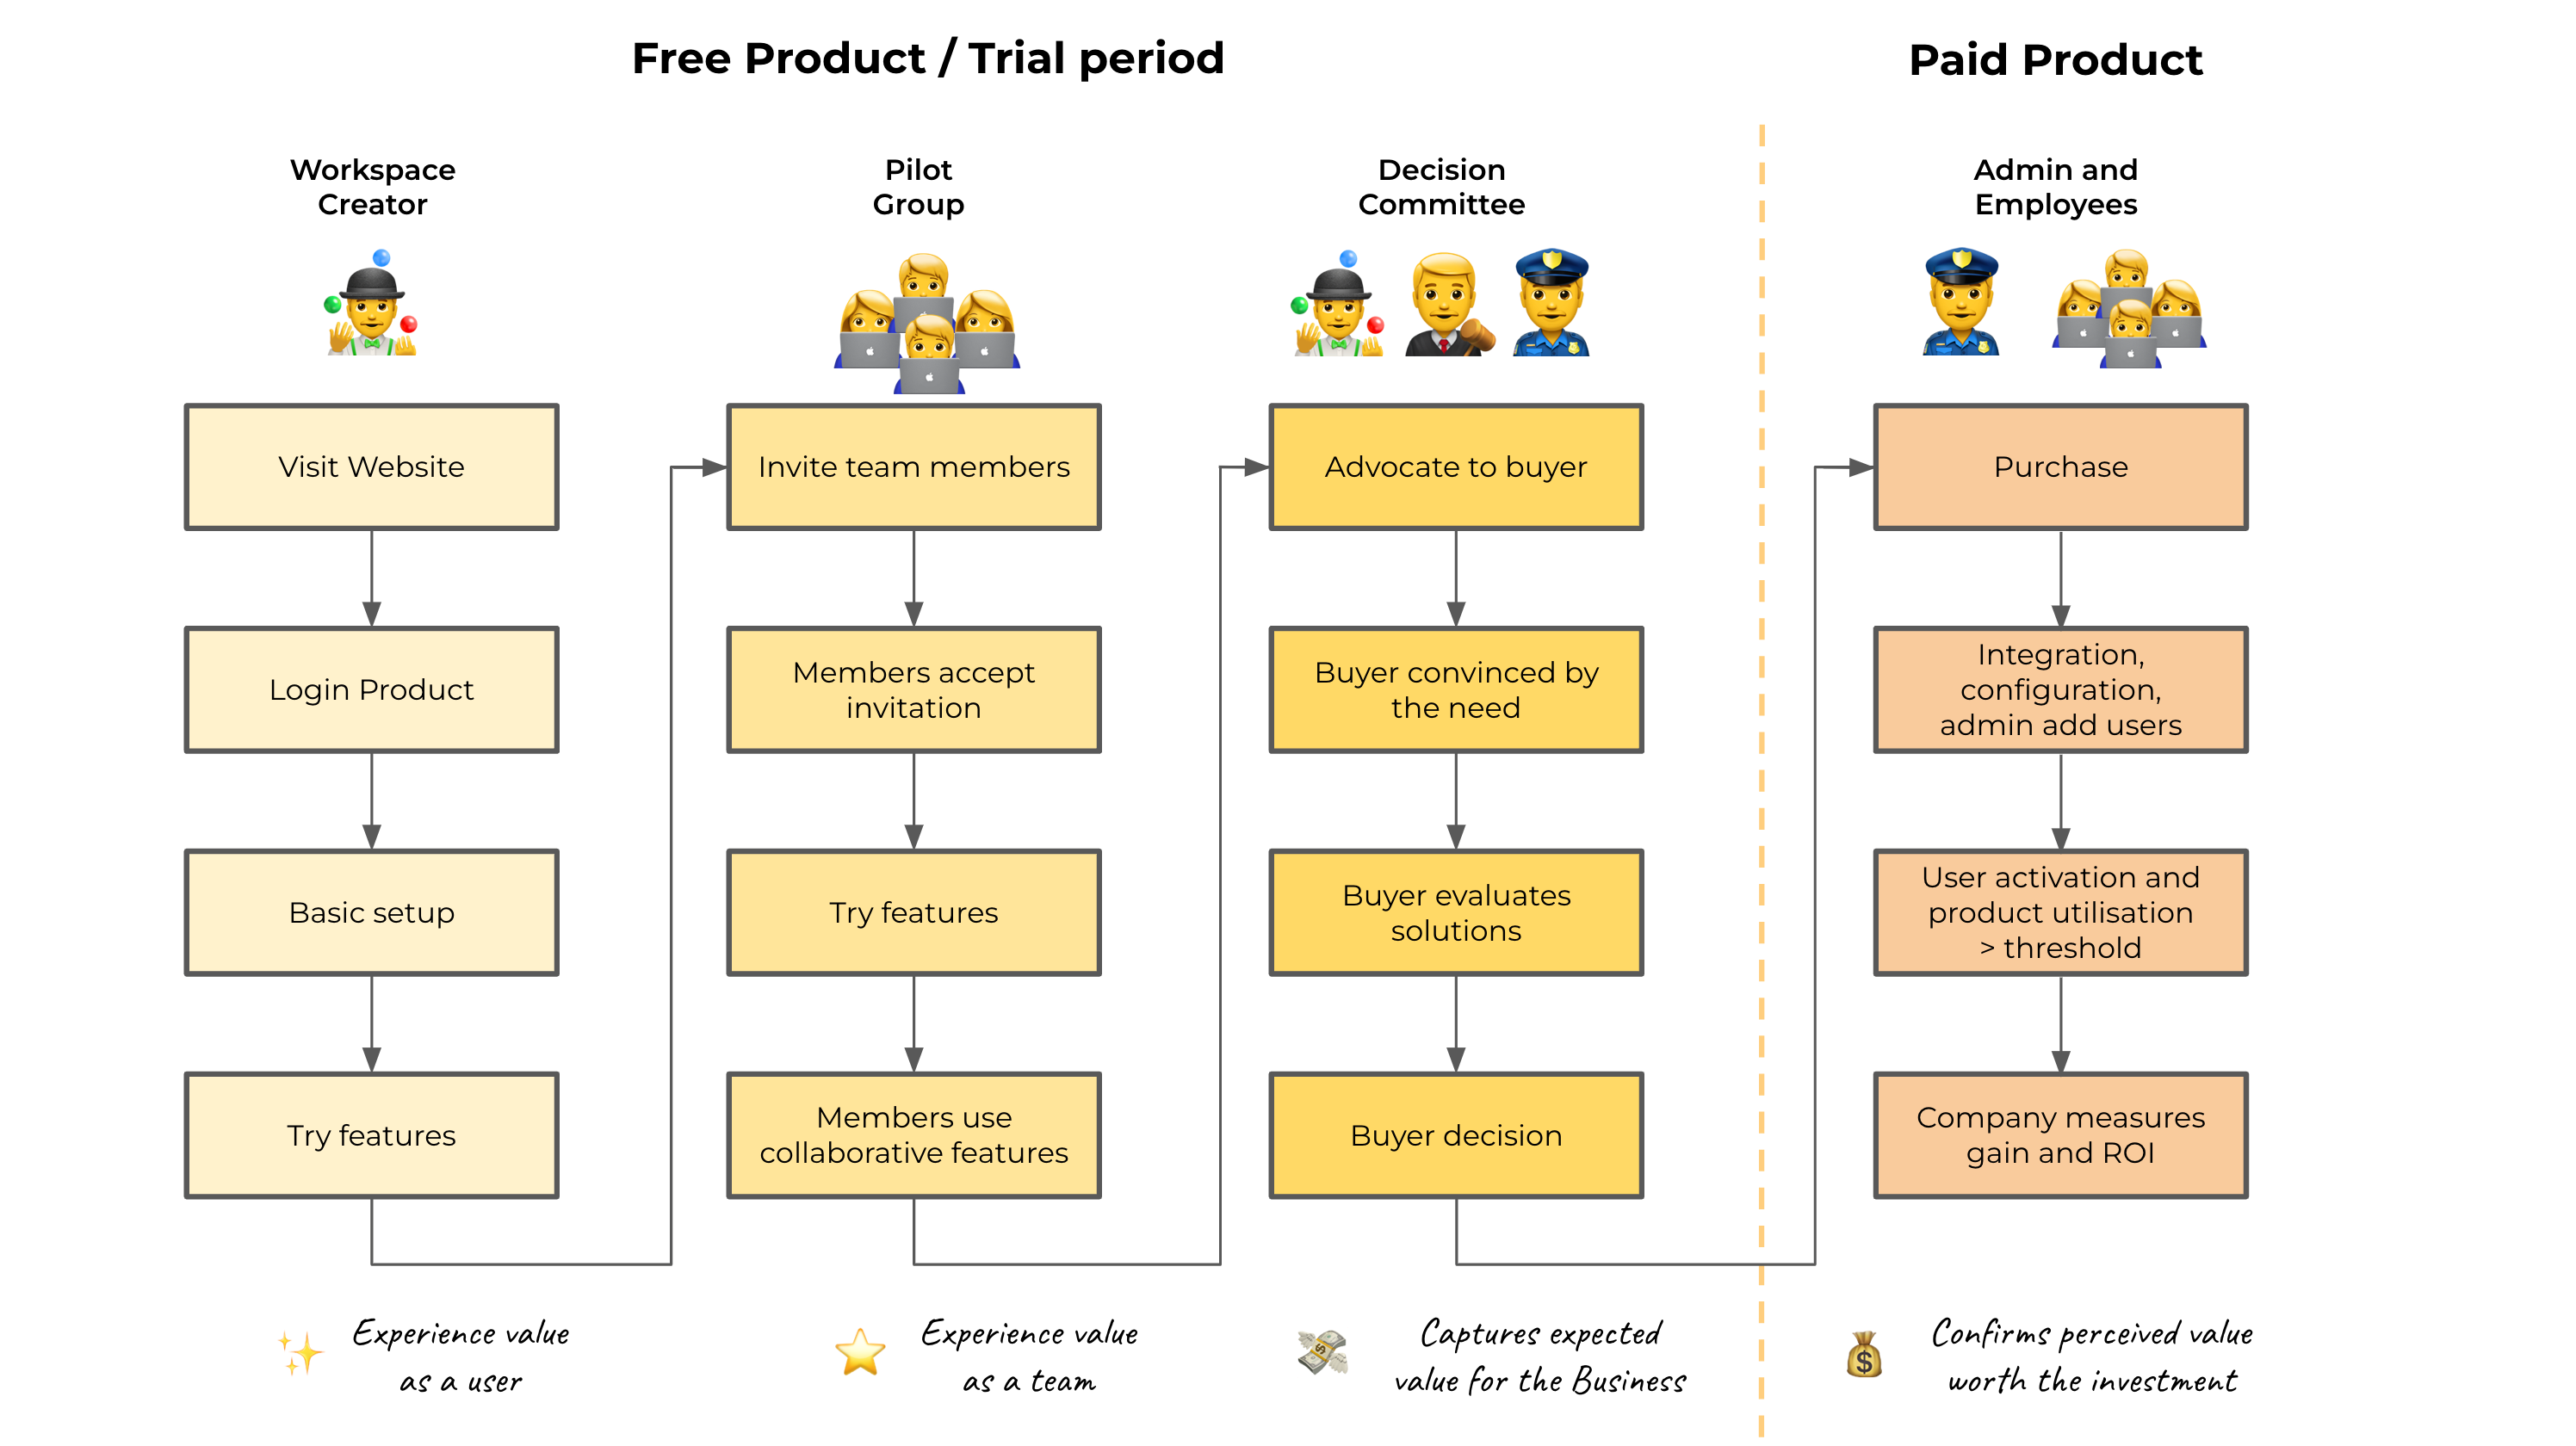
This journey map is a powerful cross-team communication and alignment tool, to build a common understanding of the story behind the purchase and adoption of the Product.
Developing a Product Analysis research plan
As Product Analysts, we can leverage this map to outline crucial questions to address at each stage of the journey and pinpoint opportunities for behavioural analyses to tackle them. Overall, we can divide our research plan into two sections:
Analyses focused on the activation journey before the initial subscription, linked to the generation of new $ARR.
Analyses dedicated to license deployment and member engagement after the initial subscription purchase, connected to the renewal and expansion of existing $ARR.
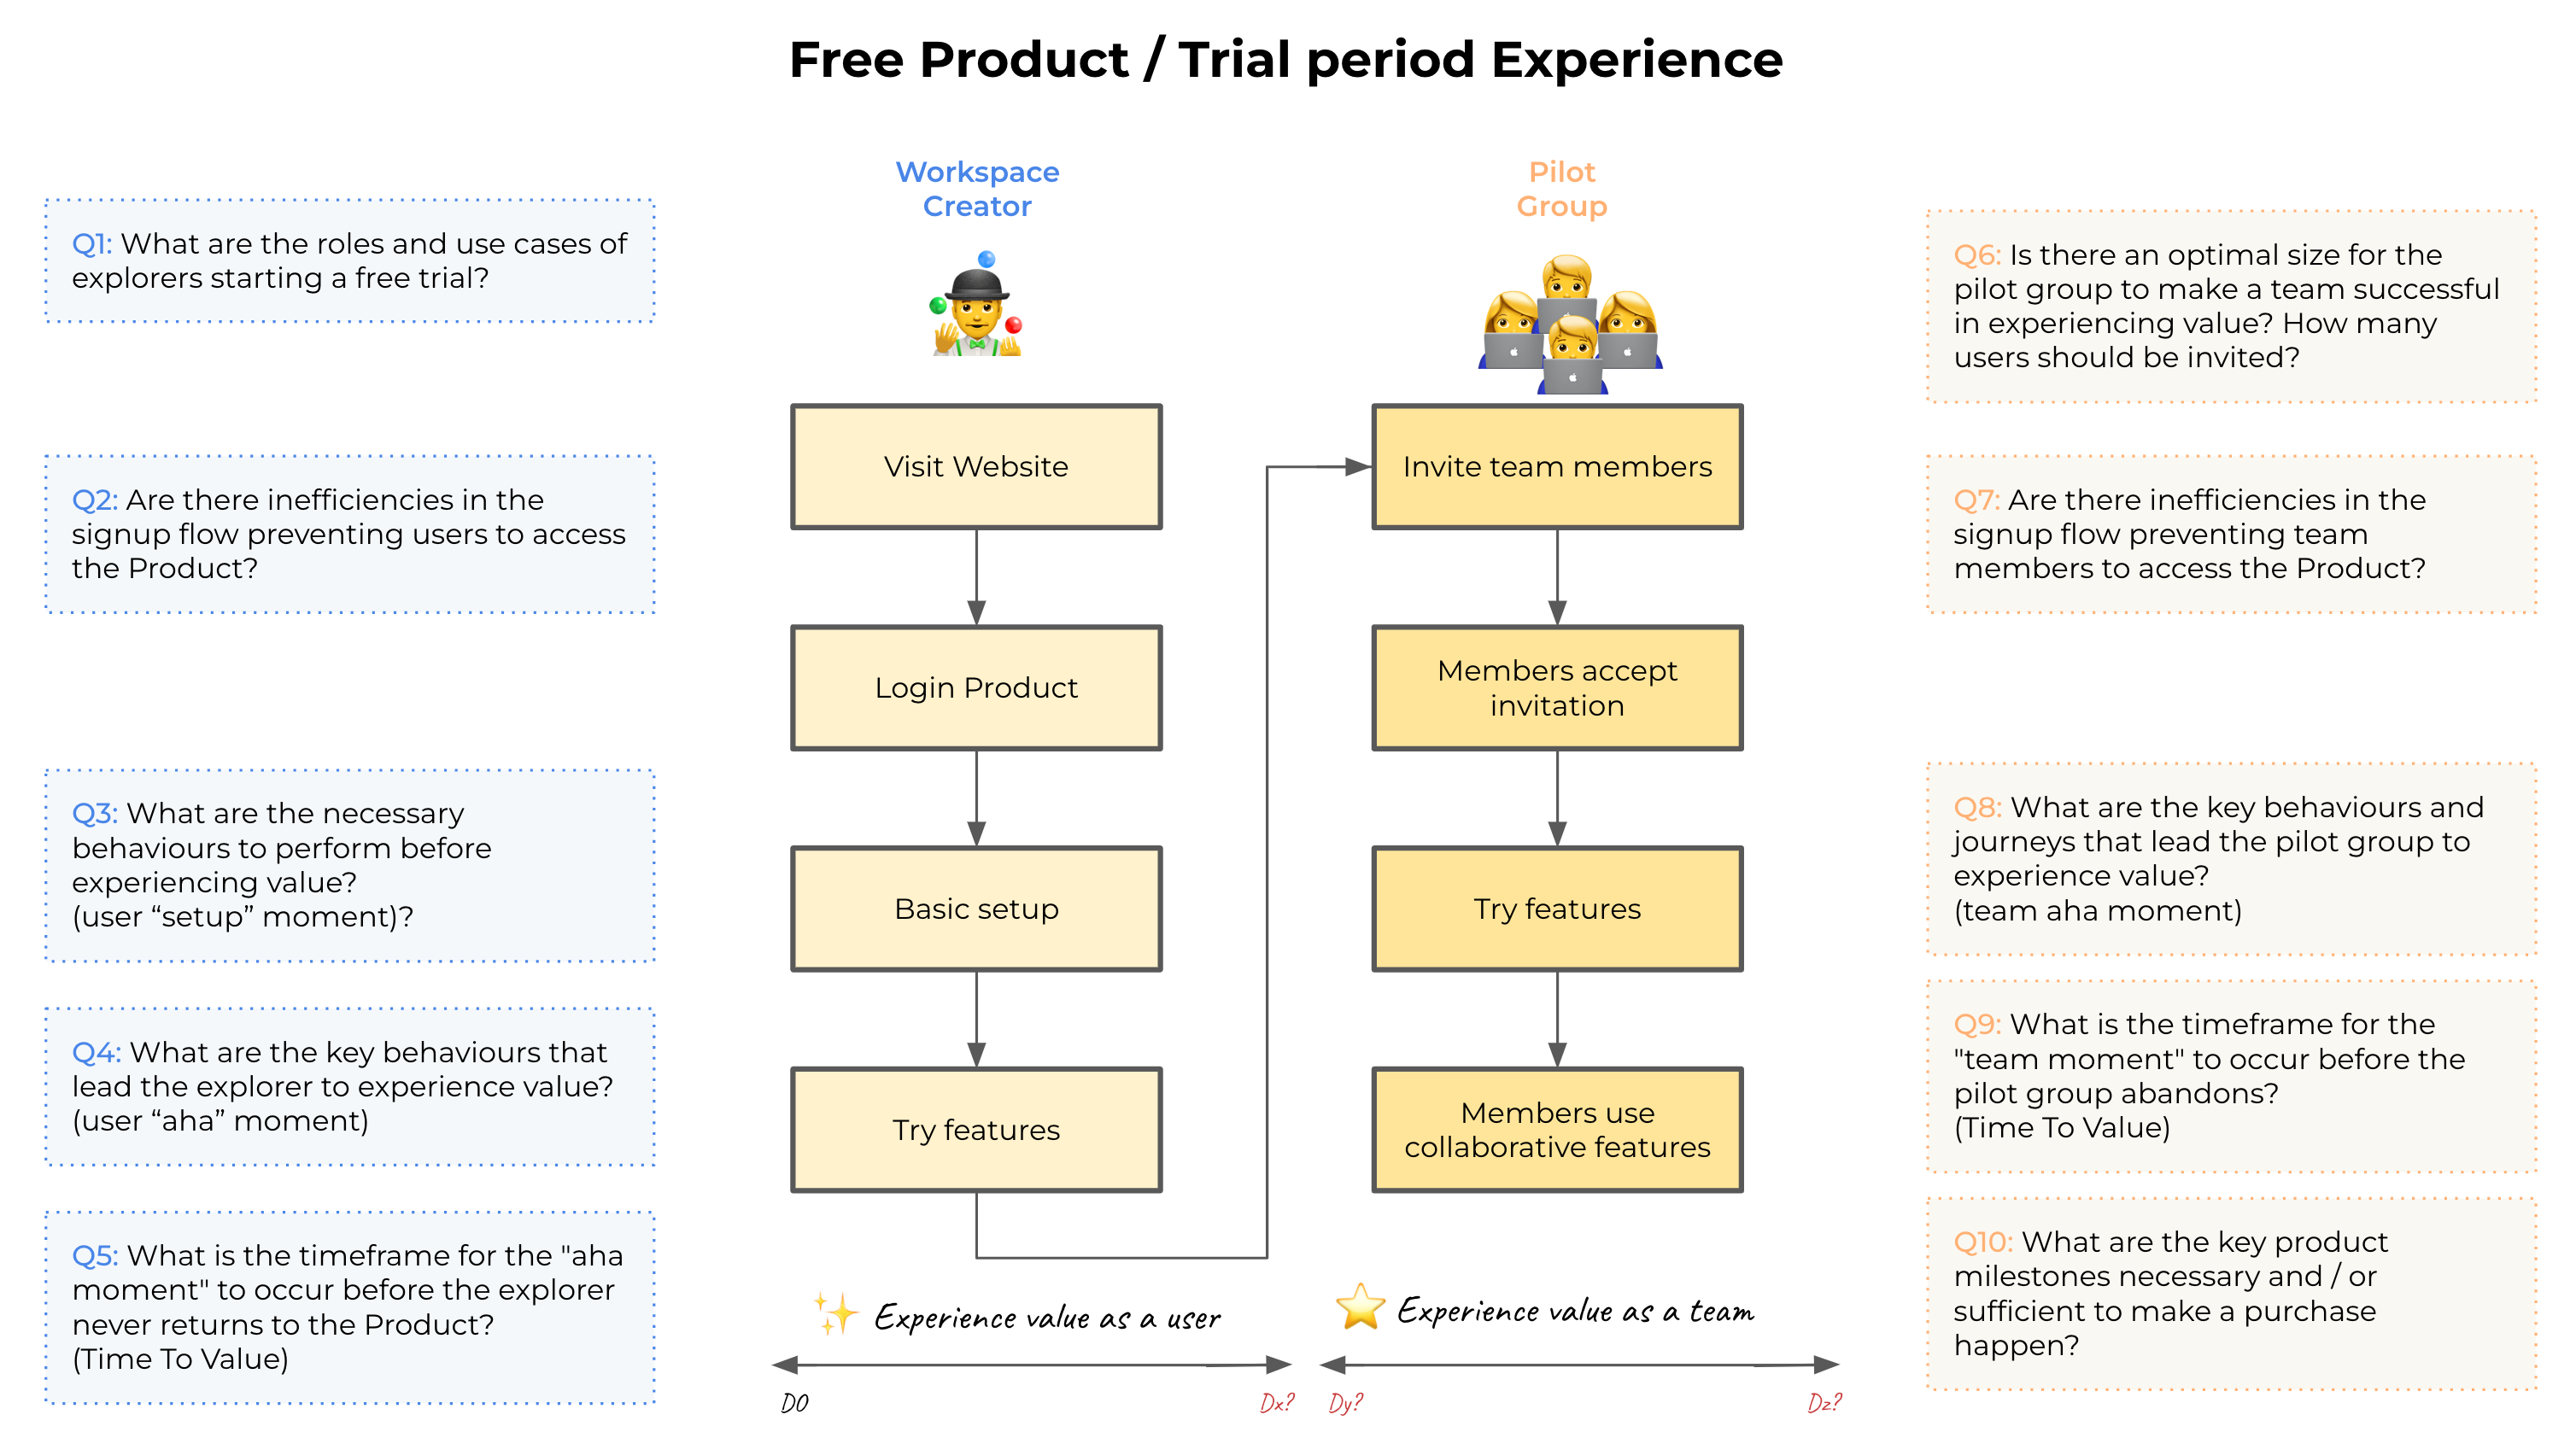
Customer Activation Analyses
Looking at the first section of the journey (involving the workspace creator and the pilot group), we can identify several key milestones for which we will need to create customised metric definitions for Miro:
Get the workspace creator to access the product (User first login).
Ensure the workspace creator experiences value as a user (User aha moment).
Guide the pilot group to access the product (Team first login).
Ensure the pilot group experiences value as a team (Team aha moment).
At this stage, success is defined by the user or team deriving sufficient value from the product, leading them to advocate for it and present it to the decision maker or buyer.
To address these questions and create customised milestone definitions for Miro, we have identified multiple product analysis playbooks that can be applied to their data.
1. Prospects profile distribution
Target population: workspace creators 🤹♂️
Problem to solve: gain insights into the demographics of users signing up for your product and their main use cases.
Analysis brief:
Examine survey data collected from onboarding profiling questions to categorise users based on factors such as use case, department, seniority, company size, and intent.
Create cluster profiles and track their distribution (percentage of acquired users, product engagement) over time to identify trends and guide product development and personalisation efforts.
2. Signup flow conversion funnel
Target population: workspace creators 🤹♂️
Problem to solve: identify where users drop off when attempting to access your product from the website signup page.
Analysis brief:
Measure users' progression through each step of the signup flow, starting from the initial landing page visit to successful registration.
Identify drop-off points to pinpoint areas needing optimisation to improve flow and boost conversion rates.
3. Customer activation moments definition
Target population: workspace creators 🤹♂️ / pilot group 🧑💻
Problem to solve: define the key moments in the activation journey—setup, aha!, and habit—at both the user and team levels. The objective is to establish custom milestone definitions for Miro based on a set of behaviours, frequency, and timeline.
Analysis brief:
Conduct a correlation analysis to identify actions that differentiate retained customers from lost ones.
Determine the combination of behaviours, frequency, and timeline that maximises retention—actions taken by most retained users but not by most lost ones. This will establish the "First Activation Event" or “aha” moment.
Then, backtrack to identify the setup moment. Ensure segmentation of the analysis at both the explorer and pilot group levels.
4. Ideal activation journey conversion funnel
Target population: workspace creators 🤹♂️ / pilot group 🧑💻
Problem to solve: evaluate the major drop-offs in the completion rate of milestones within the ideal activation journey.
Analysis brief:
Use the activation journey map and custom definitions derived from the previous analysis to identify where the most significant drop-offs occur between the signup flow page and the purchase of the first subscription.
Creating a map annotated with the drop-off rates will be a super valuable resource for both your product and marketing teams to decide in which area to invest in the customer experience and boost trial conversion rates.
5. User first session navigation analysis
Target population: workspace creators 🤹♂️ / pilot group 🧑💻
Problem to solve: understand what customers do when they first arrive, when they leave, and when they struggle to get from one place to another.
Analysis brief:
Analyse the navigation patterns of users during their initial interaction with the product, visualising which actions they take first, second, and third in unique sessions.
You can build a sunburst chart to identify common paths taken, features accessed, and potential roadblocks encountered to enhance the onboarding experience. It is also a great tool to identify the gap between your ideal activation map and how your users are onboarding on the Product.
Bonus: build a B2B account-level Product Qualified Lead score
With the insights gathered from the analyses above, you have all the foundations to build a point-based scoring system that qualifies your leads based on intent (product usage, marketing interactions) and alignment with your ideal customer profile.
The goal is to equip your Sales team with the tools and automations necessary to identify which accounts to engage with, when to reach out to them, and what message to deliver to enhance free-to-paid conversion.
For more details, you can check here how we developed a Product Qualified Leads scoring system for Dashlane.
Customer Engagement Analyses
The second part of the journey is focused on the paid Product experience, involving admin and employees. After the customer has purchased new licenses, there are a couple of challenges we are looking to solve:
Get the system administrator to invite employees to access the product.
Prompt employees to log in and experience the value as a user for the first time.
Guide employees to establish a habit around the core features of the product.
At this stage of the customer lifecycle, success is defined by fully deploying licenses to members and ensuring regular engagement with the product. The continuous engagement of members reinforces the return on investment for the buyer, ultimately leading to renewal and expansion opportunities.
We won't dive further into the buyer's "aha moment" process since interactions within the decision committee typically occur offline or outside of the product, making advanced product analysis less relevant.
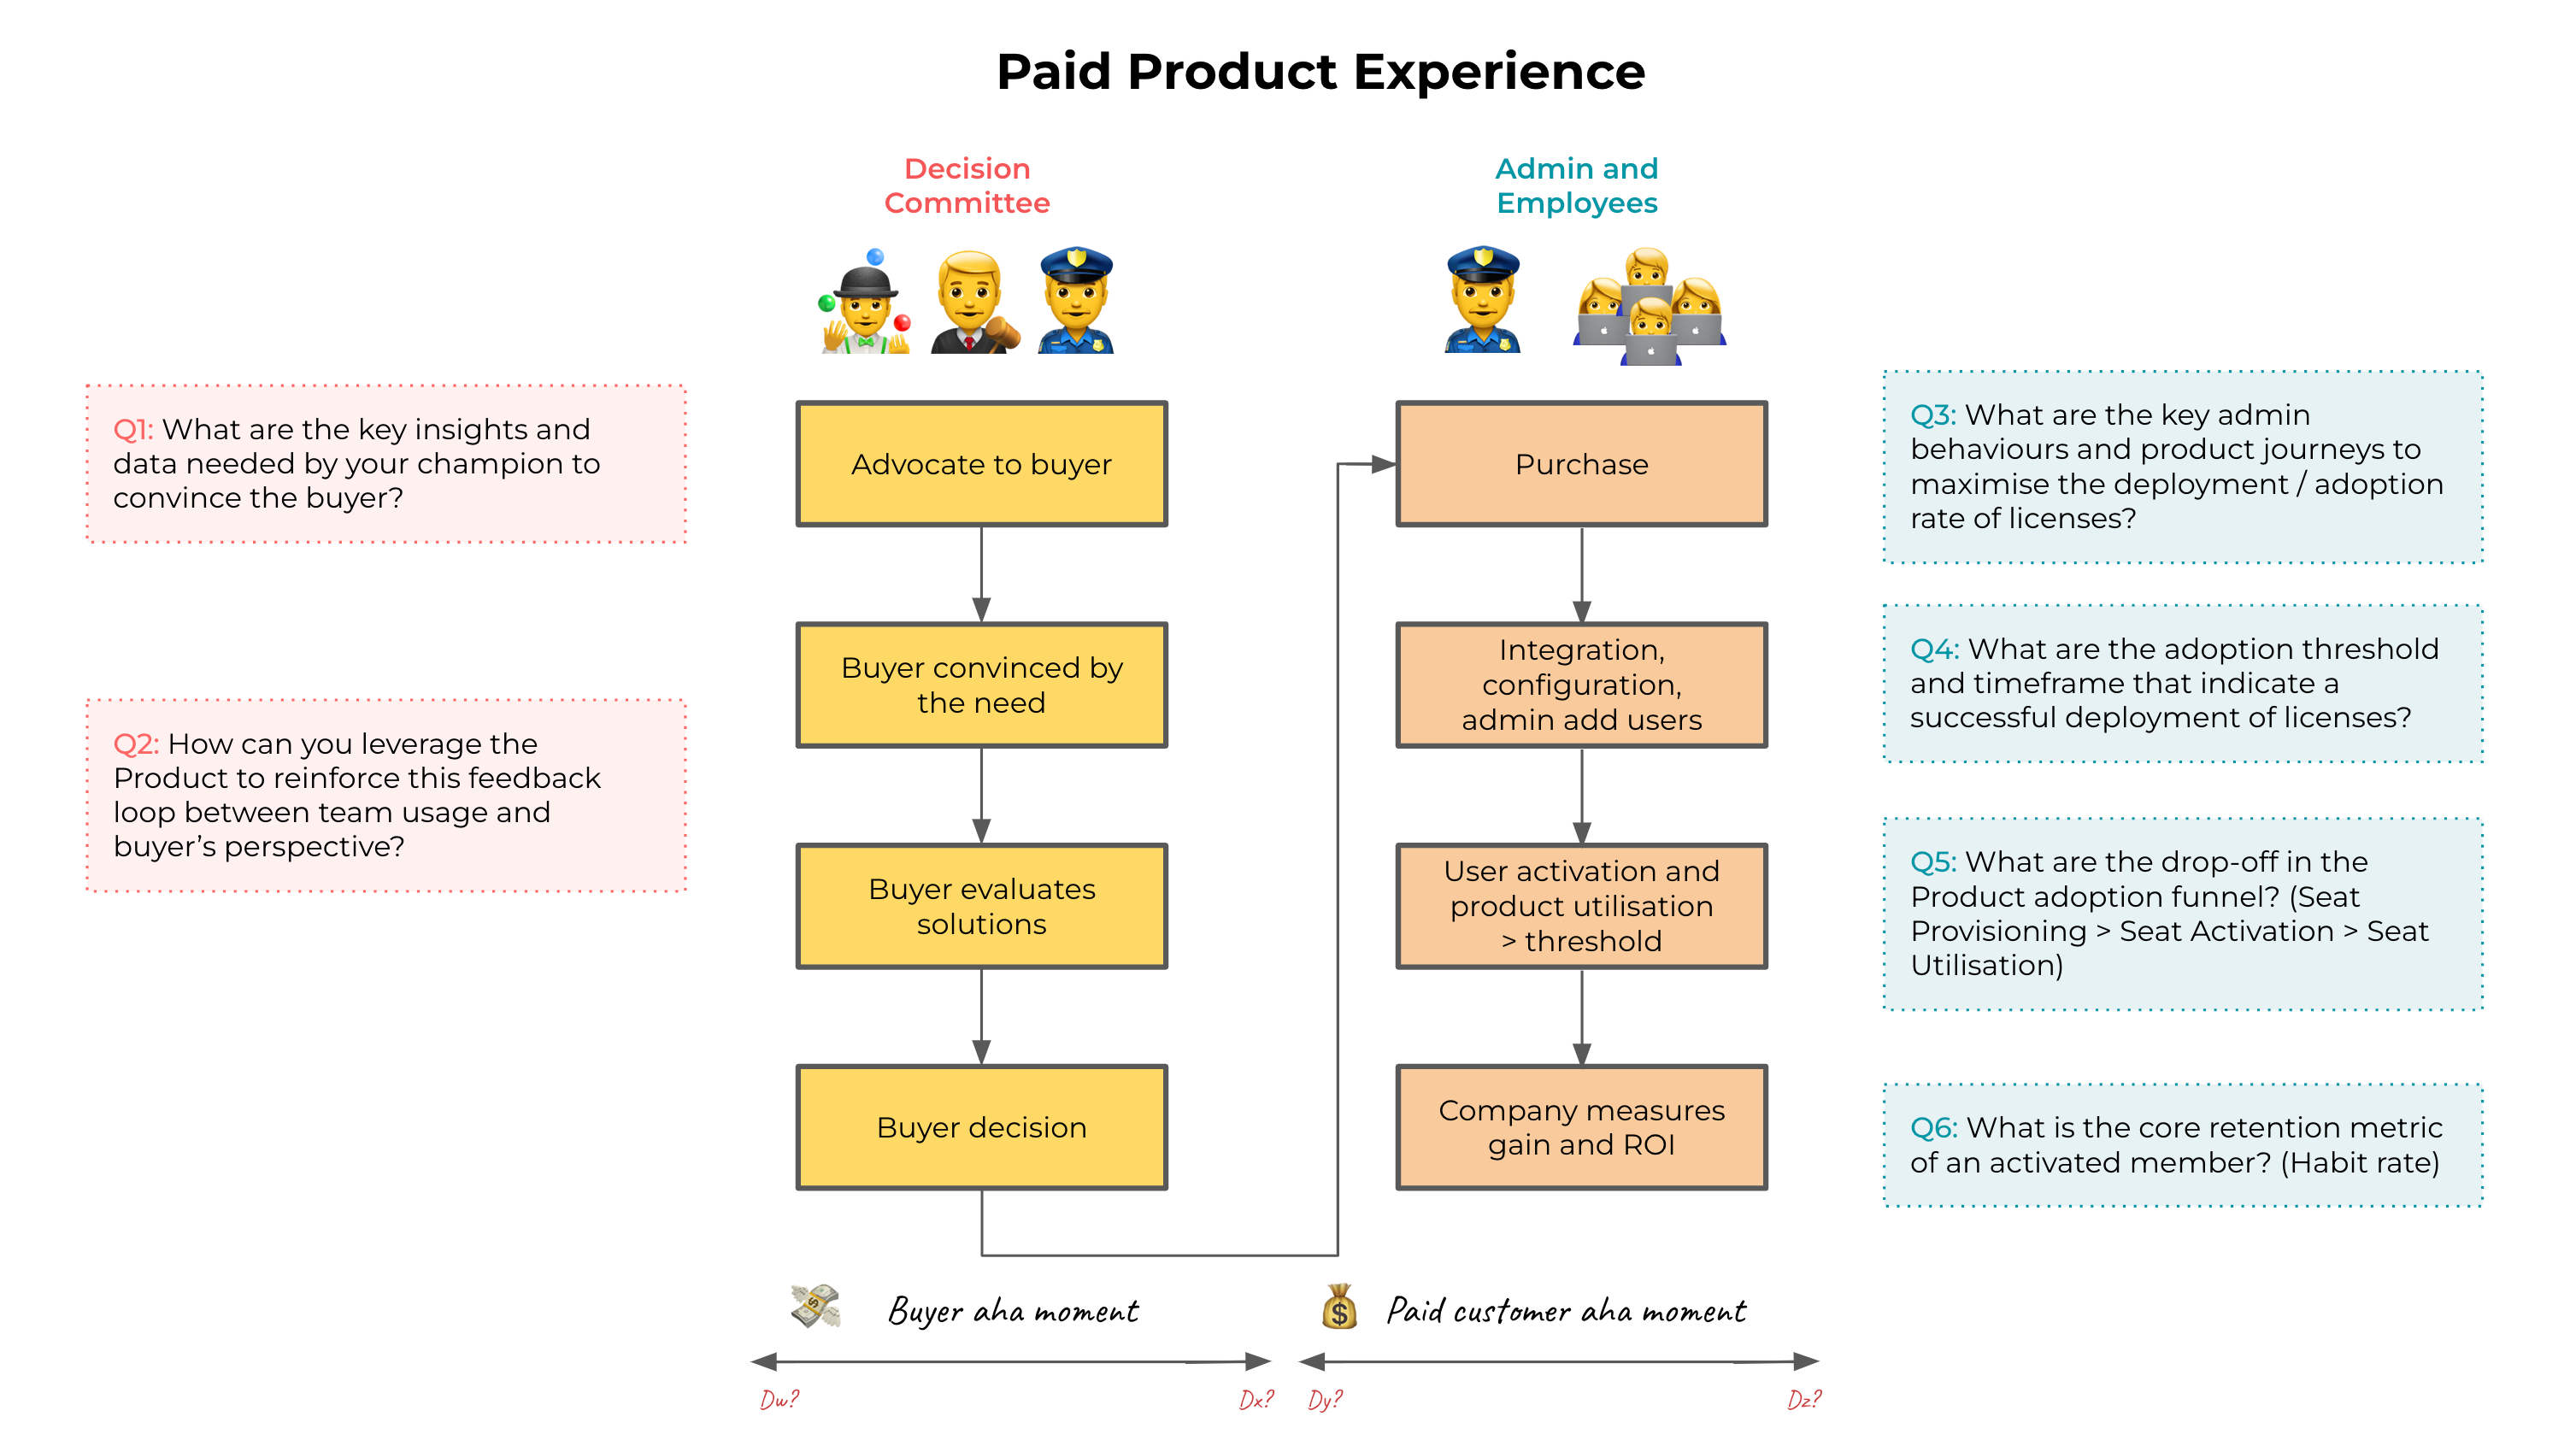
To tackle the questions outlined in the visual and create tailored metrics for Miro's team, we have compiled another set of analysis playbooks that can be applied to their data.
1. Red routes
Target population: system administrator 👮♂️ / paid members 🧑💻
Problem to solve:
Identify the most critical user journeys for both members and admins. These encompass end-to-end tasks with multiple steps or actions that address the use cases of 90%+ users and drive key behaviours.
Evaluating these areas of focus in your app is crucial to encourage admins to deploy licenses and members to engage with core features.
Analysis brief: map out all the pages and events triggered in your app and use them to build a Red Route Matrix. This involves creating a graph, segmented by persona (admin, member), where:
On the x-axis, you have adoption: the proportion of users who have seen the page at least once. The further right a page is on the graph, the more it is adopted.
On the y-axis, you have frequency: the proportion of sessions where the page is viewed. The higher up a page is on the graph, the more frequently it is seen.
2. Features adoption and engagement
Target population: system administrator 👮♂️ / paid members 🧑💻
Problem to solve:
Identify the features in your product that generate the most user engagement. This is essential for prioritising efforts to enhance features in the paid experience and forming assumptions about the behaviours driving member habits.
Develop a clear mental map of the roles of each feature, identifying the ones best suited for optimisation, monetisation, as well as those that should be sunsetted.
Analysis brief:
Start by creating a consolidated view of features across your product. Then, for each feature, compute metrics that indicate both the frequency and depth of user engagement.
Look at what percentage of total Monthly Active Users (MAUs) have access to the feature, what percentage of users have interacted with it over a given timeframe, how often and how much it has been used, and the proportion of users likely to return to use the feature again.
You can find more details about the methodology in this post from Olga Berezovsky.
3. Member core retention metric definition
Target population: paid members 🧑💻
Problem to solve: define the leading indicator at the member level that traduces healthy product engagement and the likelihood of long-term retention. Referred to as the "habit metric," this is the one metric you want to continuously monitor and maintain at a high level of quality to ensure control over customer retention.
Analysis brief:
Your member retention metric relies on two key components: the frequency at which users experience the problem and the core product behaviour that addresses this issue.
Begin by listing hypotheses regarding the optimal values for these factors, drawing from user research and intuition. Then, analyse standard retention curves for each action-frequency combination. This comparison enables you to determine which hypothesis best predicts retention.
The most effective core action-frequency combination should demonstrate a higher retention rate and a flatter shape, indicating stable retention over time.
4. Users state machine
Target population: paid members 🧑💻
Problem to solve:
Every individual can be categorised into one of five states regarding your product: never used, first-time user, high-value user, low-value user, or inactive user. These states are connected by arrows, representing user transitions between states.
Each month, every person moves along one of these arrows. The objective is to move as many users as possible to the "high-value" bucket. This mapping provides a comprehensive understanding of user engagement and helps evaluate which transitions are most important for your business at any given time.
As you increase the share of high-value members per paying customer, the more likely they will be to renew and expand. For more details on this concept, initiated by Phil Libin, the CEO of Evernote, refer to this video.
Analysis brief:
The main challenge in this project is defining custom states for your business (e.g.: what constitutes an inactive user? What's the distinction between a high-value and low-value user?).
Once these definitions are established, you can calculate them monthly at the member level and generate a report highlighting each user's transitions between states.
Bonus: build a customer health score to prevent churn risks
Leverage the insights you created to build a customer health score. It should be a single number representing how “healthy” or engaged you believe a customer is, and the value they are getting out of your product.
It’s a tool your customer success team can leverage to understand how customers are doing, which customers they should spend more time with, and specific areas where they can make a bigger impact.
You can find out more details into how we approached this problem at Dashlane and built our own score here. We also recommend taking a look at Omni’s approach in this blog post.
Conclusion
Overall, the questions outlined in the journey map ensure you don't overlook any aspects in your monitoring and understanding of the user experience. They provide you with a solid research plan for your business, which can be addressed through product analytics.
This post lays out the "what" by providing a plan for analysing customer behaviours. In upcoming posts, we'll dive into the technical execution—the "how"—of foundational analyses, offering open-source templates that can be tailored to your data.
If you're enjoying this newsletter, share it with a friend and subscribe if you haven't already, that would mean a lot for us. Thanks for your support 🙏