

The Data Informed Experimentation System
Build your experimentation system to get new insights at a fast pace. Kickstart the compounding effect now.


Let’s start with a short story
It’s really hard to release impactful work in Product.
How do you know you’re going in the right direction?
How do you know you’re making extra revenue from months of work?
There is no magic.
No one knows.. before trying!
Most successful tech companies experiment continuously.
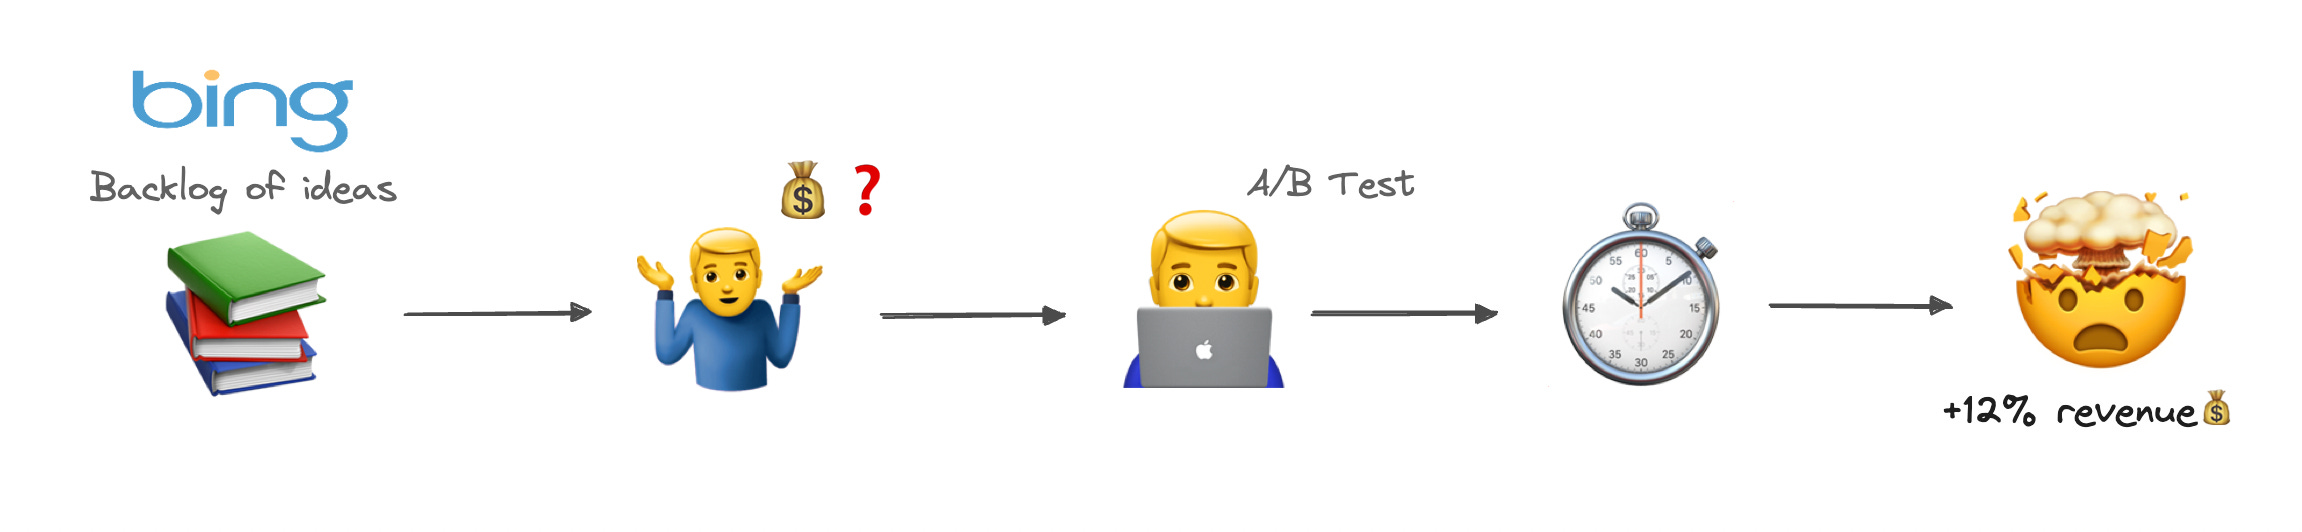
In 2012 a Microsoft employee working on Bing had an idea.
It was a very low effort task but lost among hundreds of other ideas.
Six months later, an engineer decided to implement the change and launched a simple A/B Test.
An analysis showed that the change had increased revenue by 12%.
It’s equivalent to $100 million on an annual basis for Bing.
It was the best revenue-generating idea in Bing’s history.
But until the test, its value was underappreciated.
From The Surprising Power of Online Experiments - Harvard Business Review, 2017
What’s in it for you
Hi I’m Manuel 👋 I’m a Senior Product Analyst, passionate about Product Growth and Experimentation. In this post I share my vision, frameworks, methods and best reads about Product Experimentation and I hope it can help you build your own system!
I’m convinced Analytics teams have a crucial role to play in product development. Though Data won’t make decisions for you. Staring at a compass won’t land you anywhere…
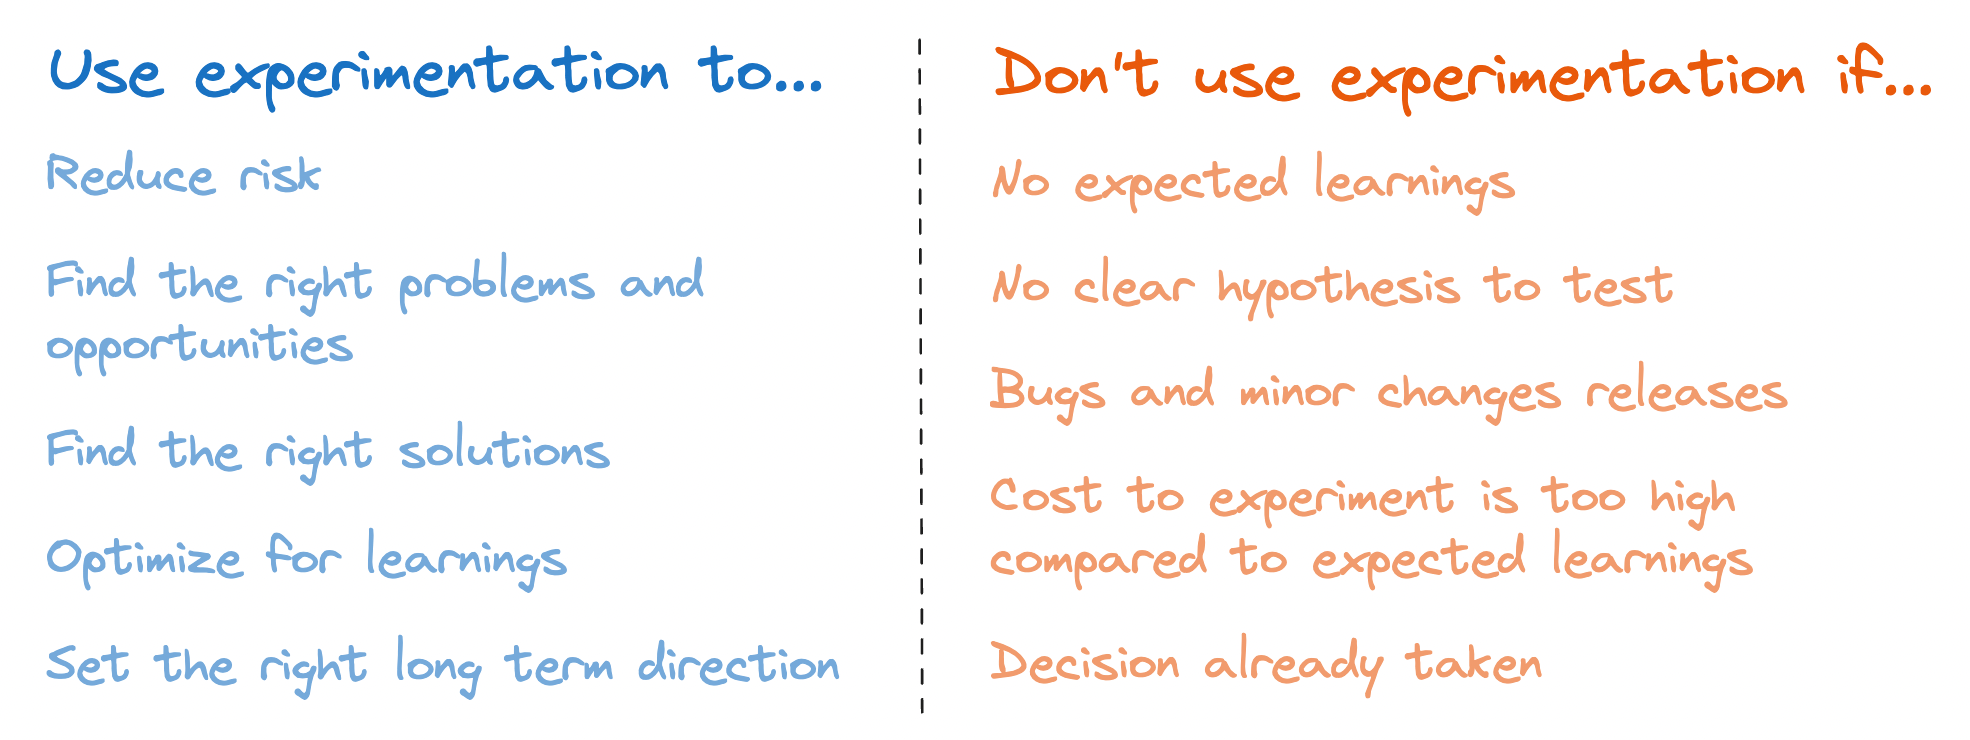
Experimentation is about interacting with the Product and users to generate fresh new insights, complementing foundational data analyses that provide the initial context.
Having an experimentation mindset is specifically useful when you’re trying to achieve a long term goal but there could be different opportunities and different possible solutions for each opportunity.
In this article we’ll go through:
Why invest in experimentation
How to build your Experimentation System
The Team
The System (+Example)
The Toolbox: Experiments, Goal setting and Impact measurement
How to make it work in your company
My favorite experimentation resources
Why invest in experimentation
Experimentation is about progressively uncovering the right path with trial and error, opposed to long term risky bets.
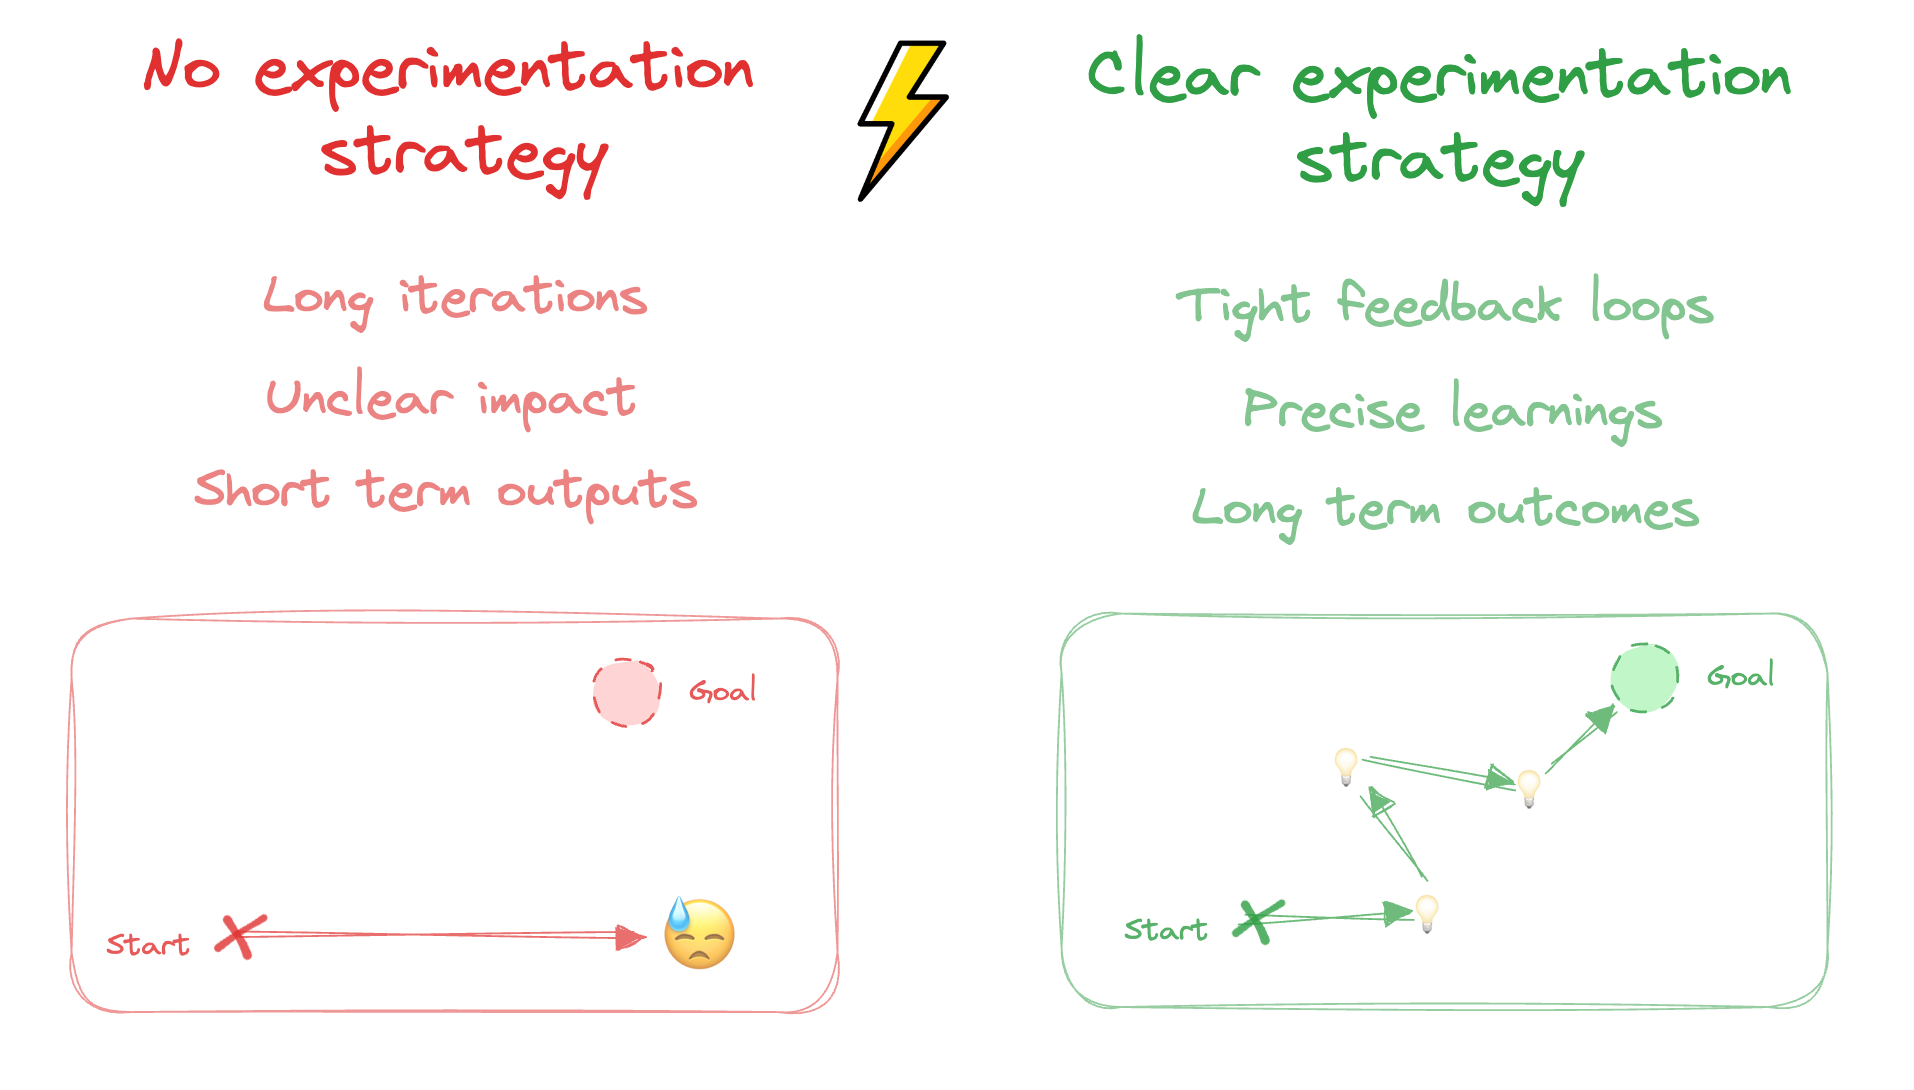
In his interview on Lenny’s Podcast, Marty Cagan highlights the difference between feature teams (focused on outputs) and empowered product teams (focused on outcomes).
Delivering outputs is easy, but it does not guarantee you’ll generate any tangible value for customers nor for the company.
Outcomes are about uncovering true problems and scaling solutions that create tangible value and unlock business levers, which is way harder.
How do you do that in one shot? You can’t.
So you need to try, fail and most importantly: learn, at a fast pace. The faster you can do that, the quicker you’ll generate business impact.
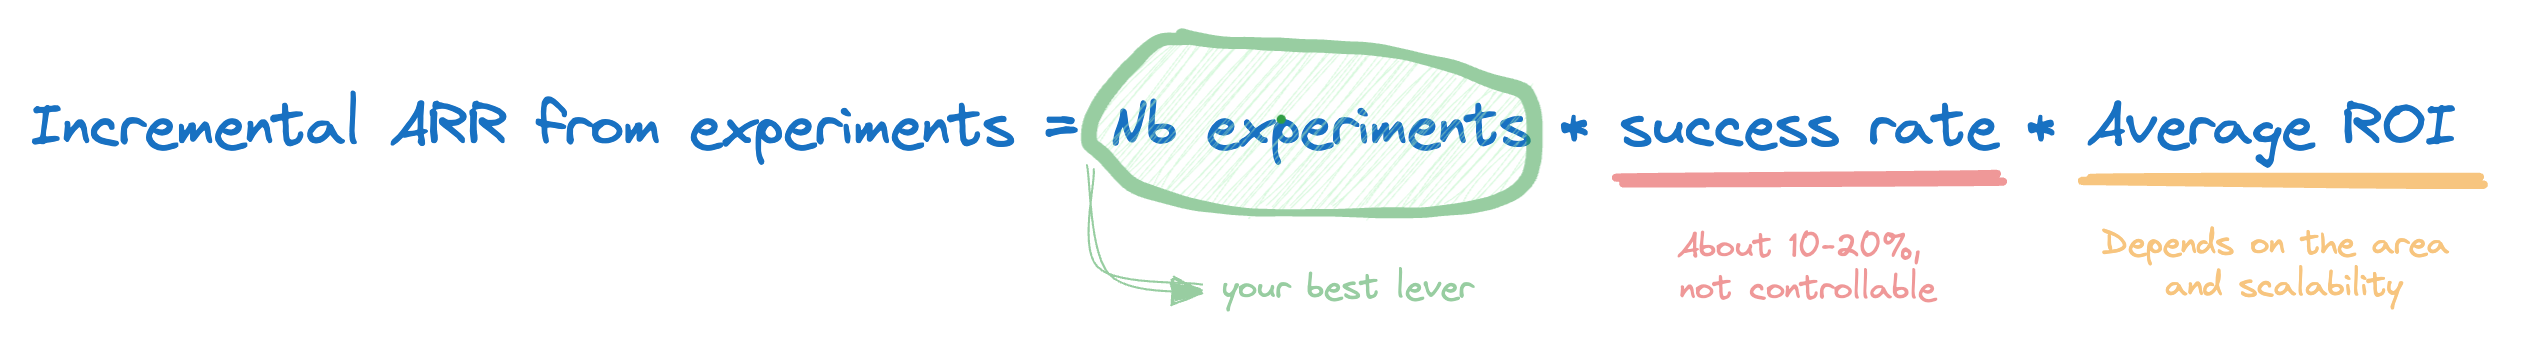
Knowing that only 10-20% experiments result in significant positive outcomes at Google and Bing (source), the lever we have most control on is the amount of launched experiments.
Eventually, the key to success is to compound learnings at a satisfying pace so that each experiment launched gets you closer to creating long term value.
How to build your Experimentation System
Having a system will allow you to go faster, be more consistent on the long run and get stronger results. You need 3 things to build that system:
A Team: lean, empowered, small and motivated to test, fail and learn
A Framework: to be rigorous and consistent over time
A Toolbox: to implement new changes fast and measure results robustly
Let’s take a closer look at these 3 core components to build for a high-performance system.
The Team
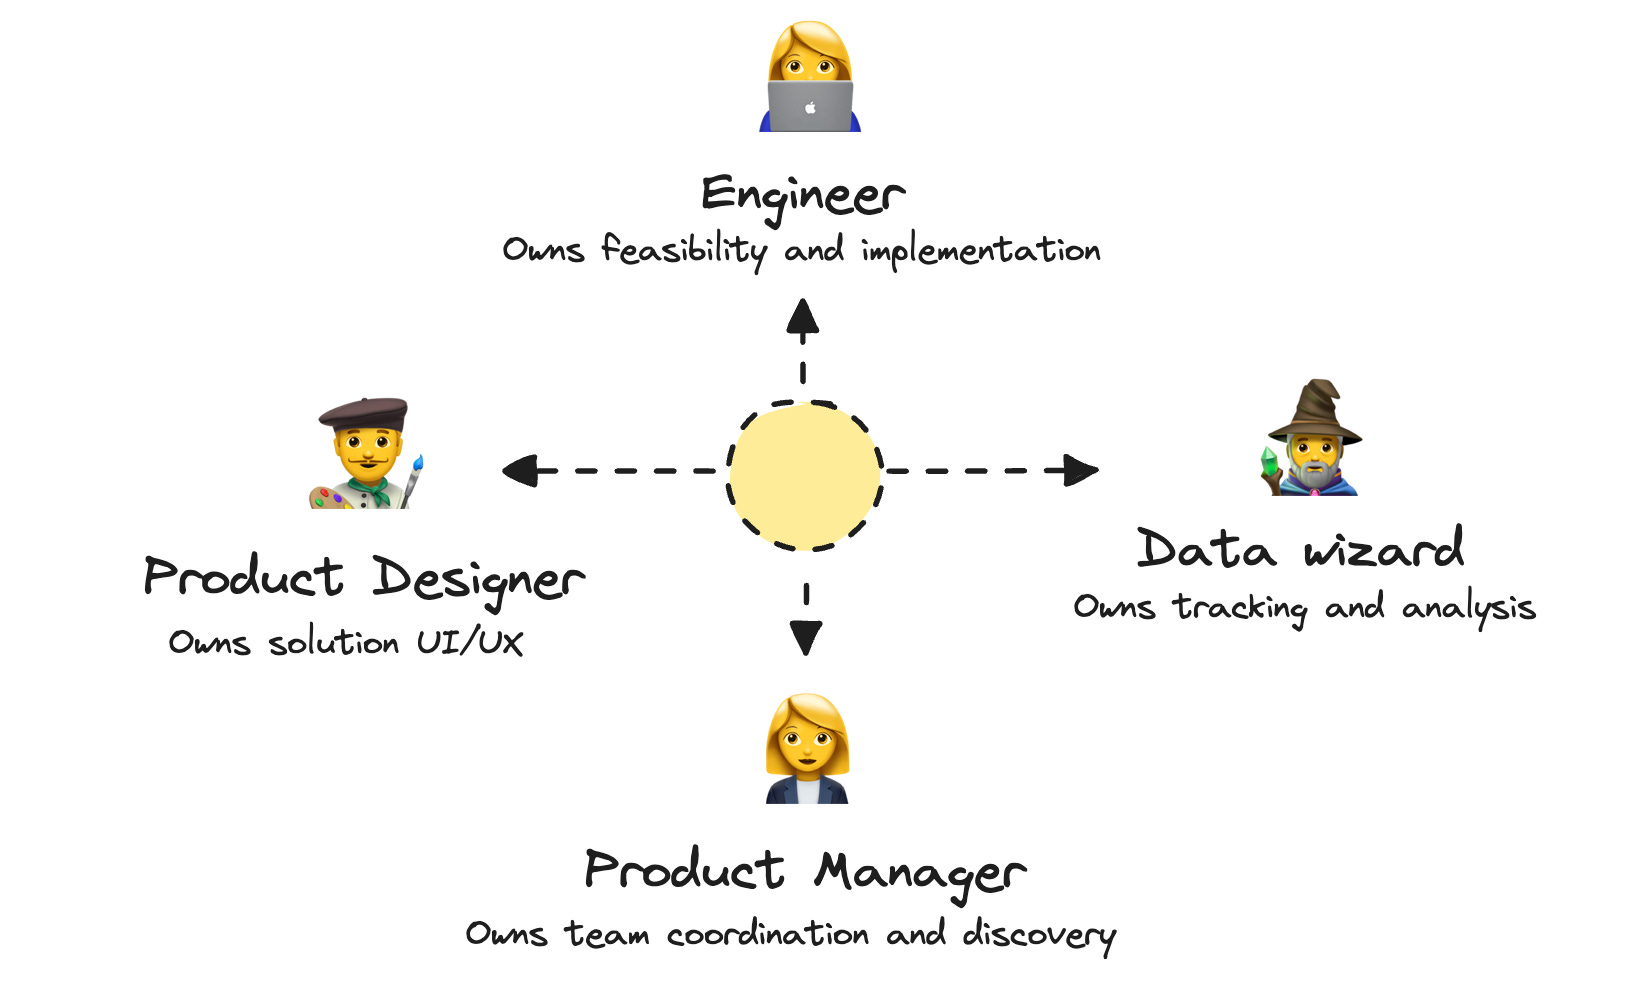
If you’re working on a SaaS product your ideal crew would look like:
A Product Manager: owns resources management and team coordination
A (Product) Data Analyst: owns data tracking, metrics and analysis
A Product Designer: owns UI, UX and pairs on discovery with PM
An Engineer: owns feasibility, technical constraints and implementation
The ideal team should be lean, empowered and excited about their mission with a great dynamic and cohesion between members.
It’s important to keep a strong alignment and tight feedback loops so the team can have a recurring ritual to quickly discuss past results and learnings, share their current work and align on next steps.
The System
Spotify Growth team’s framework
The trap we all fall into is to let our brain think about solutions instead of focusing on problems first. To avoid that, Spotify developed what they call the Thoughtful Execution Tree. I highly recommend reading the full article as it sets a true vision and foundation on the Experimentation process.
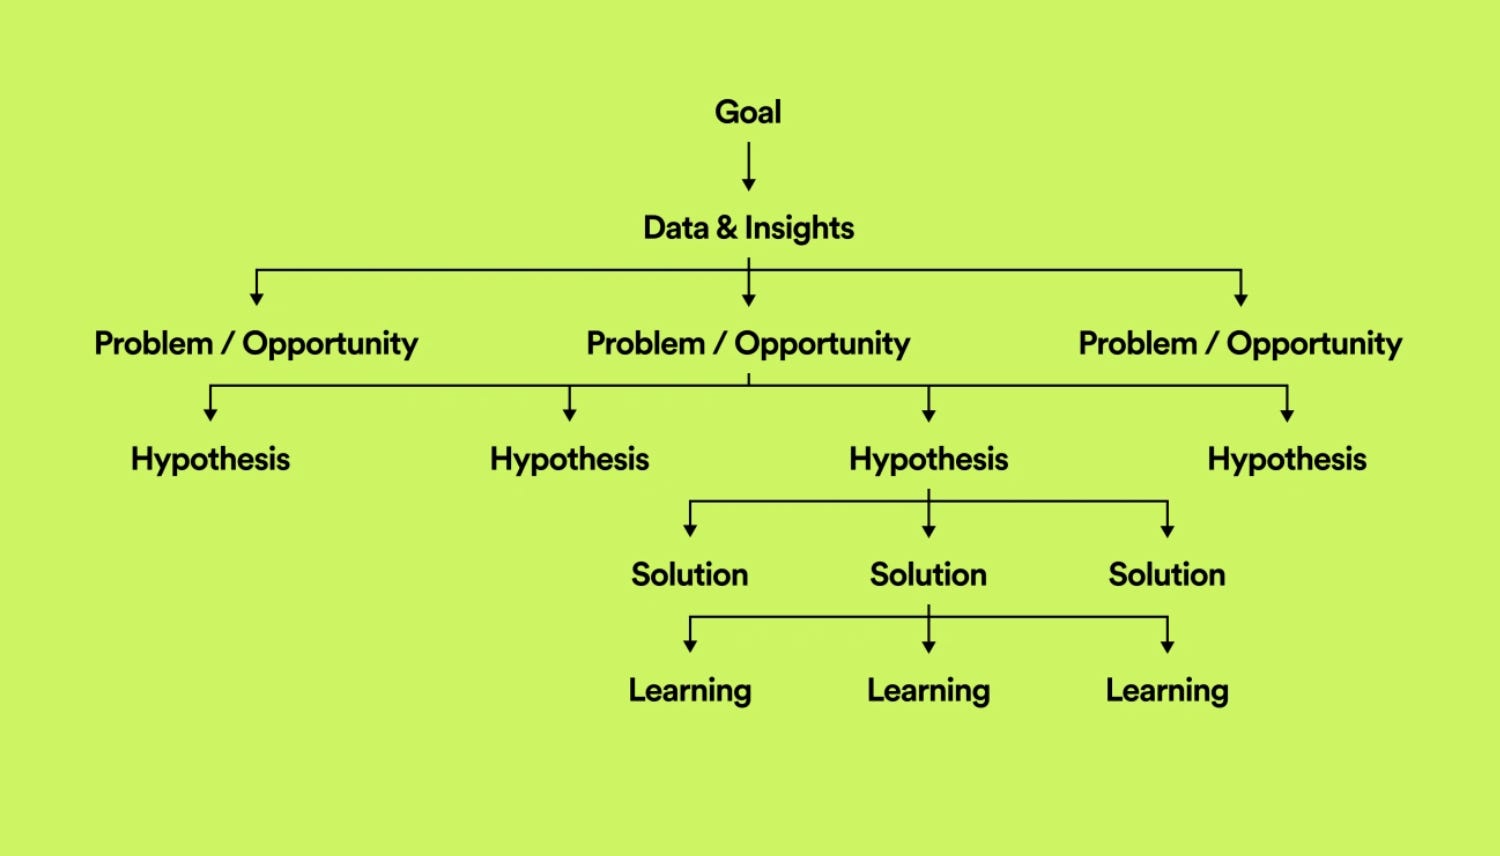
The Thoughtful Execution Tree puts data and insights at the core of the process and leverages collective intelligence cycles as opposed to endless gut-driven solutions owned by a single person or team.
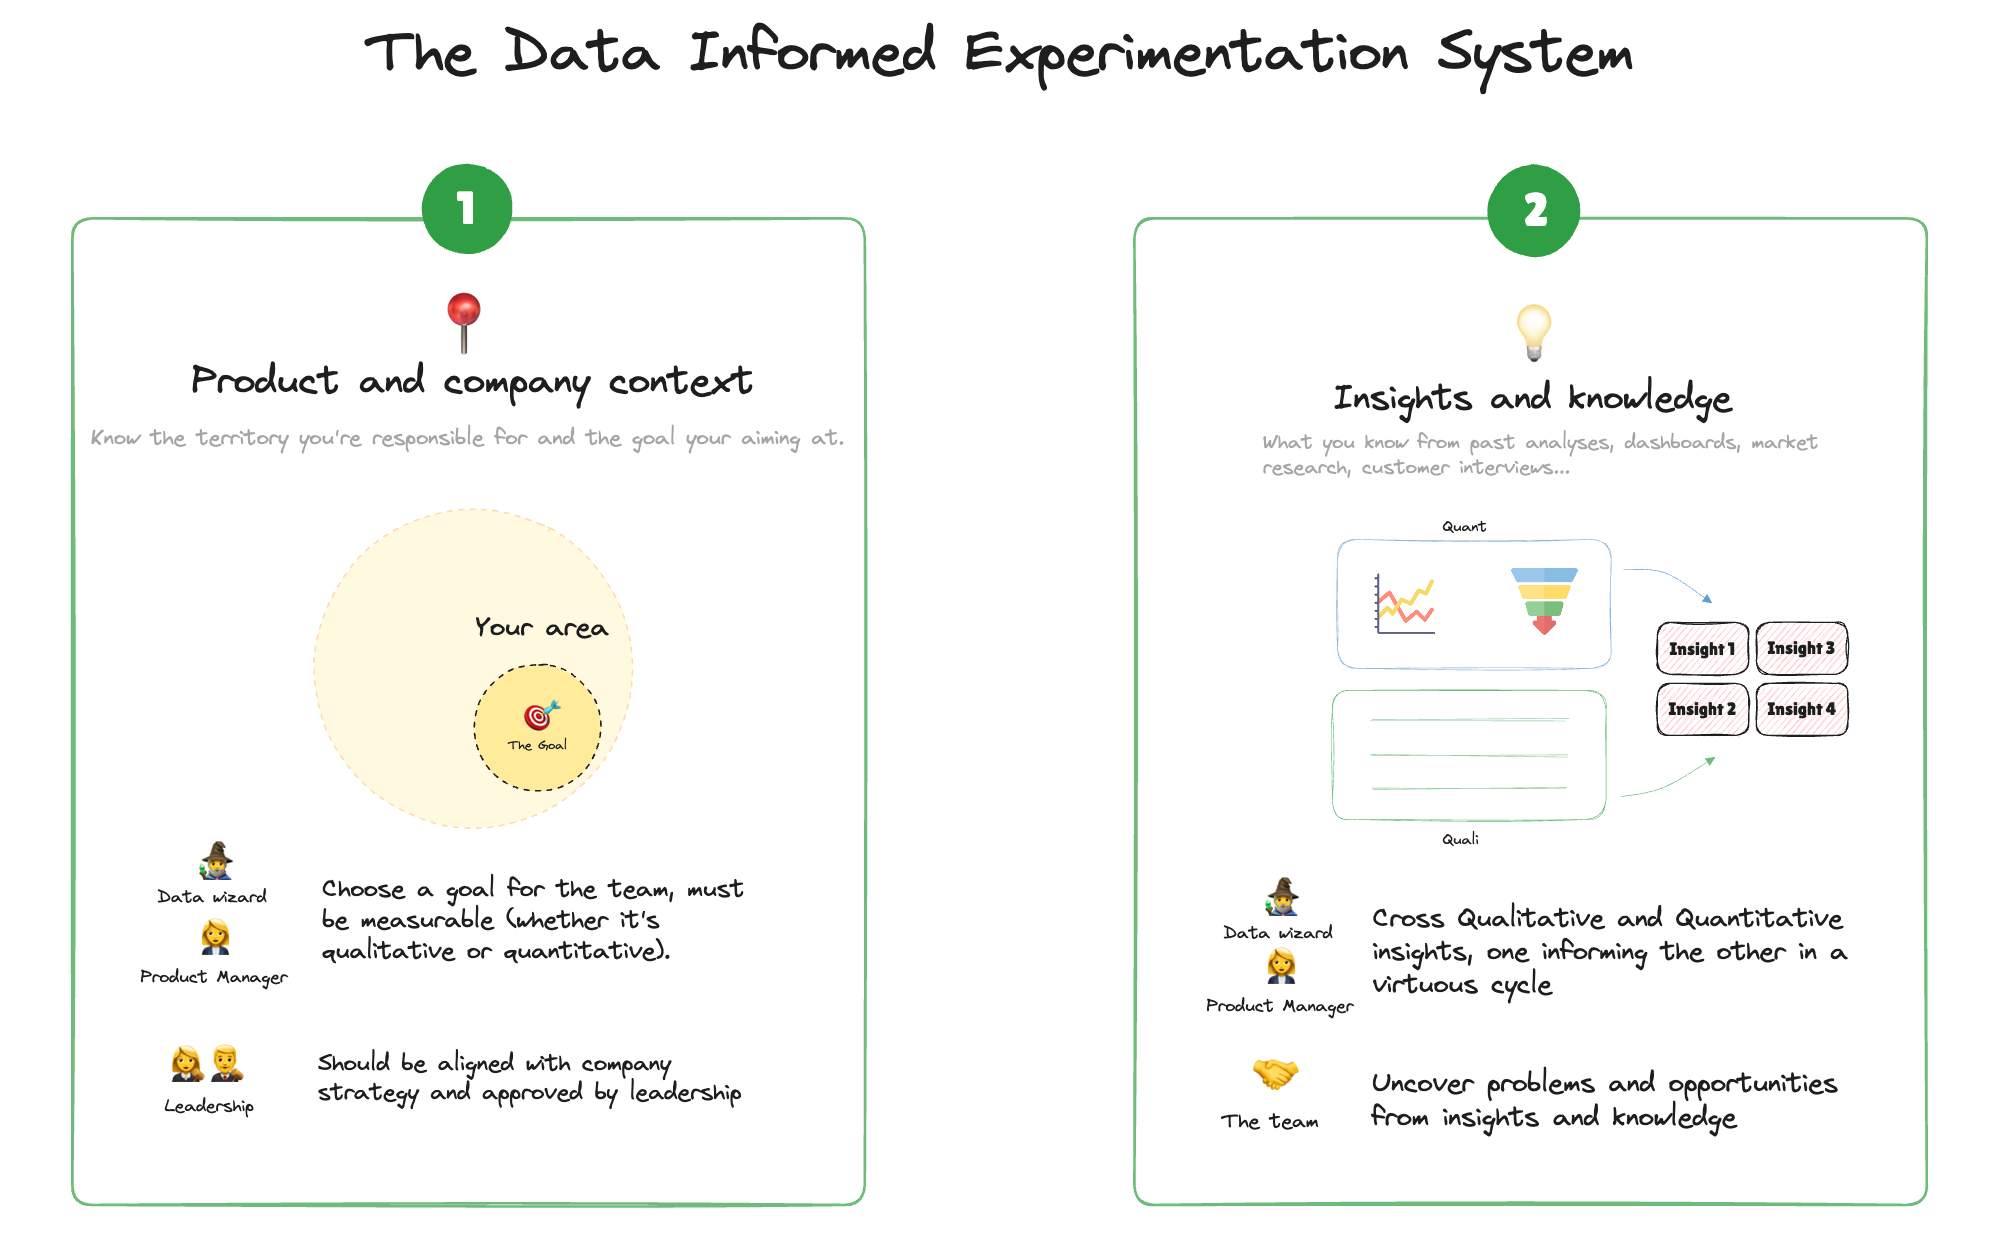
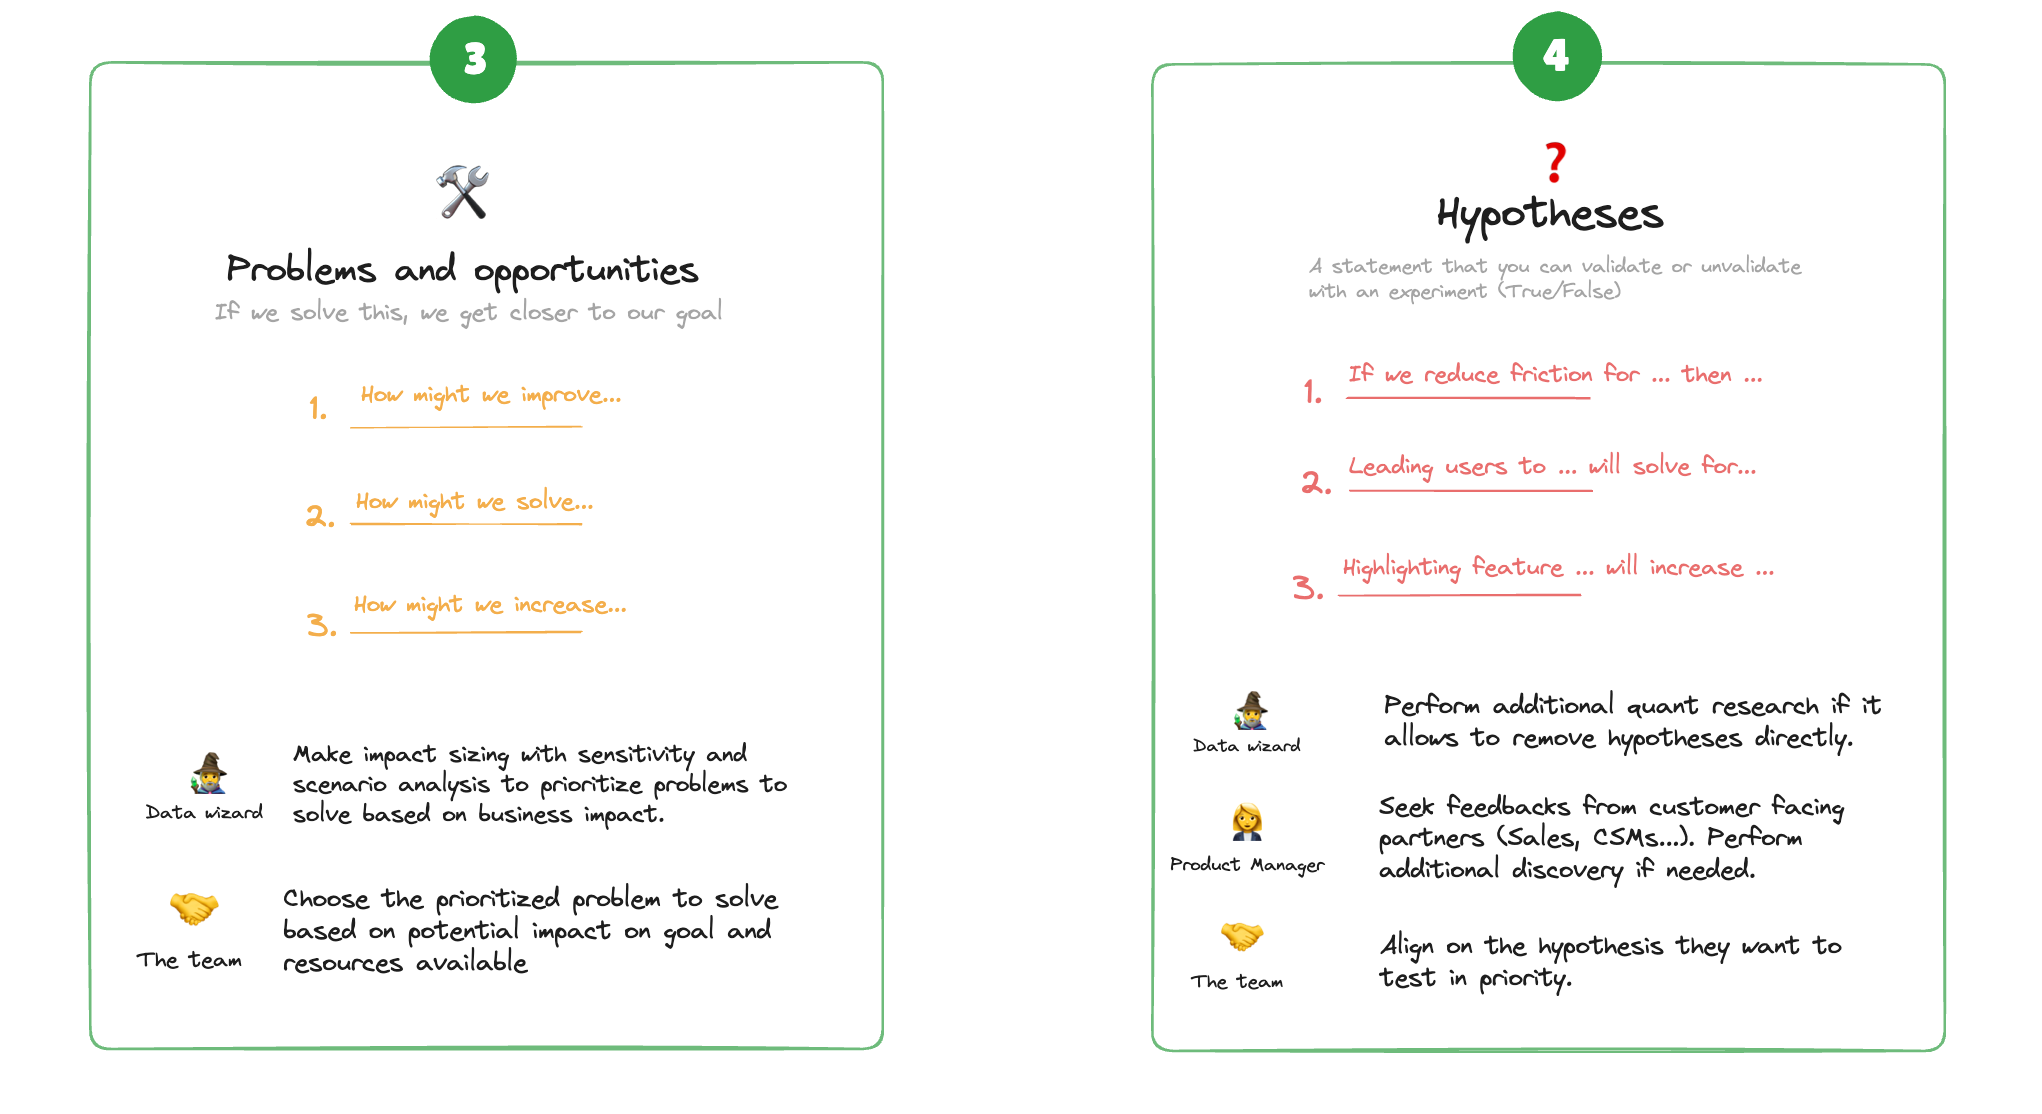
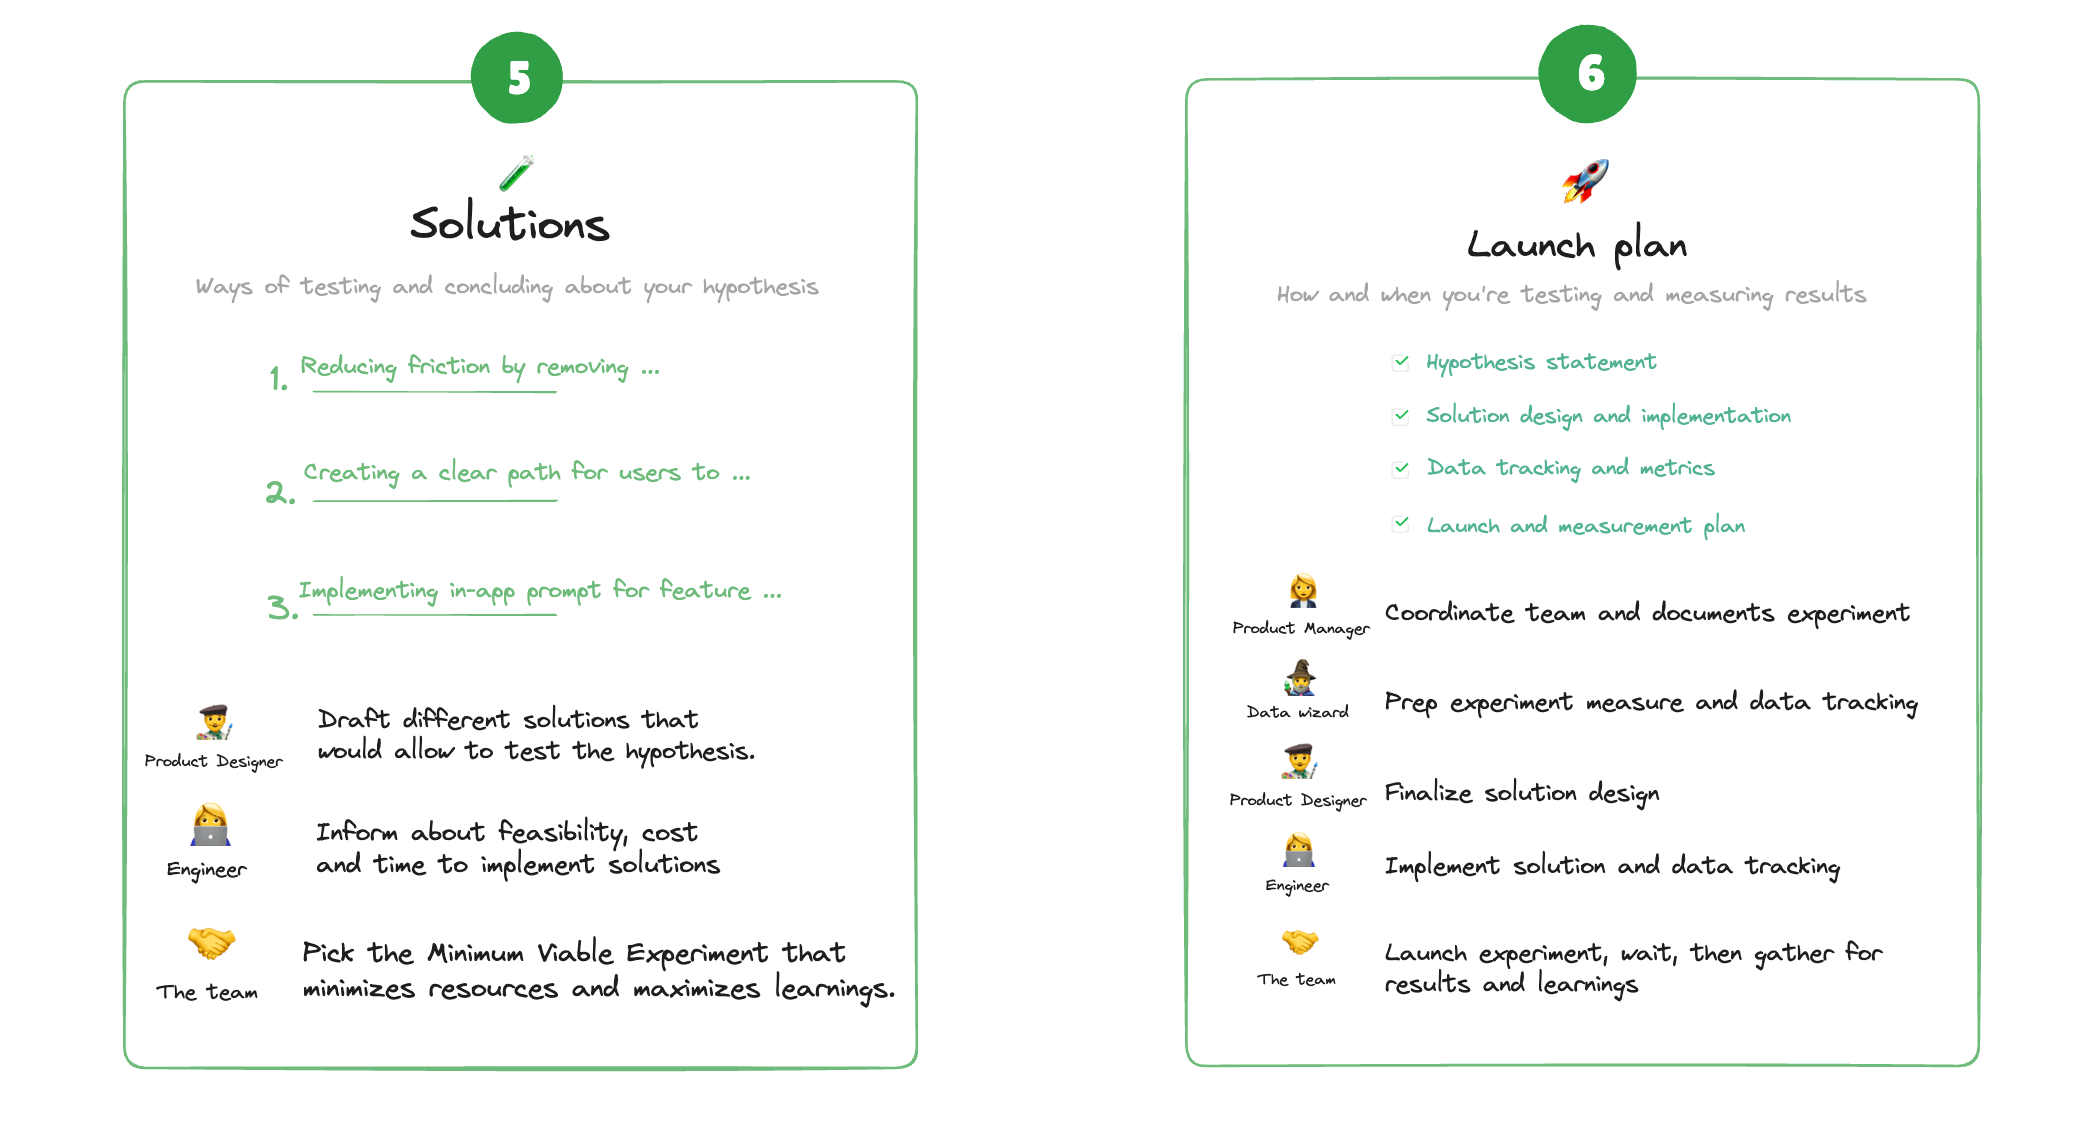
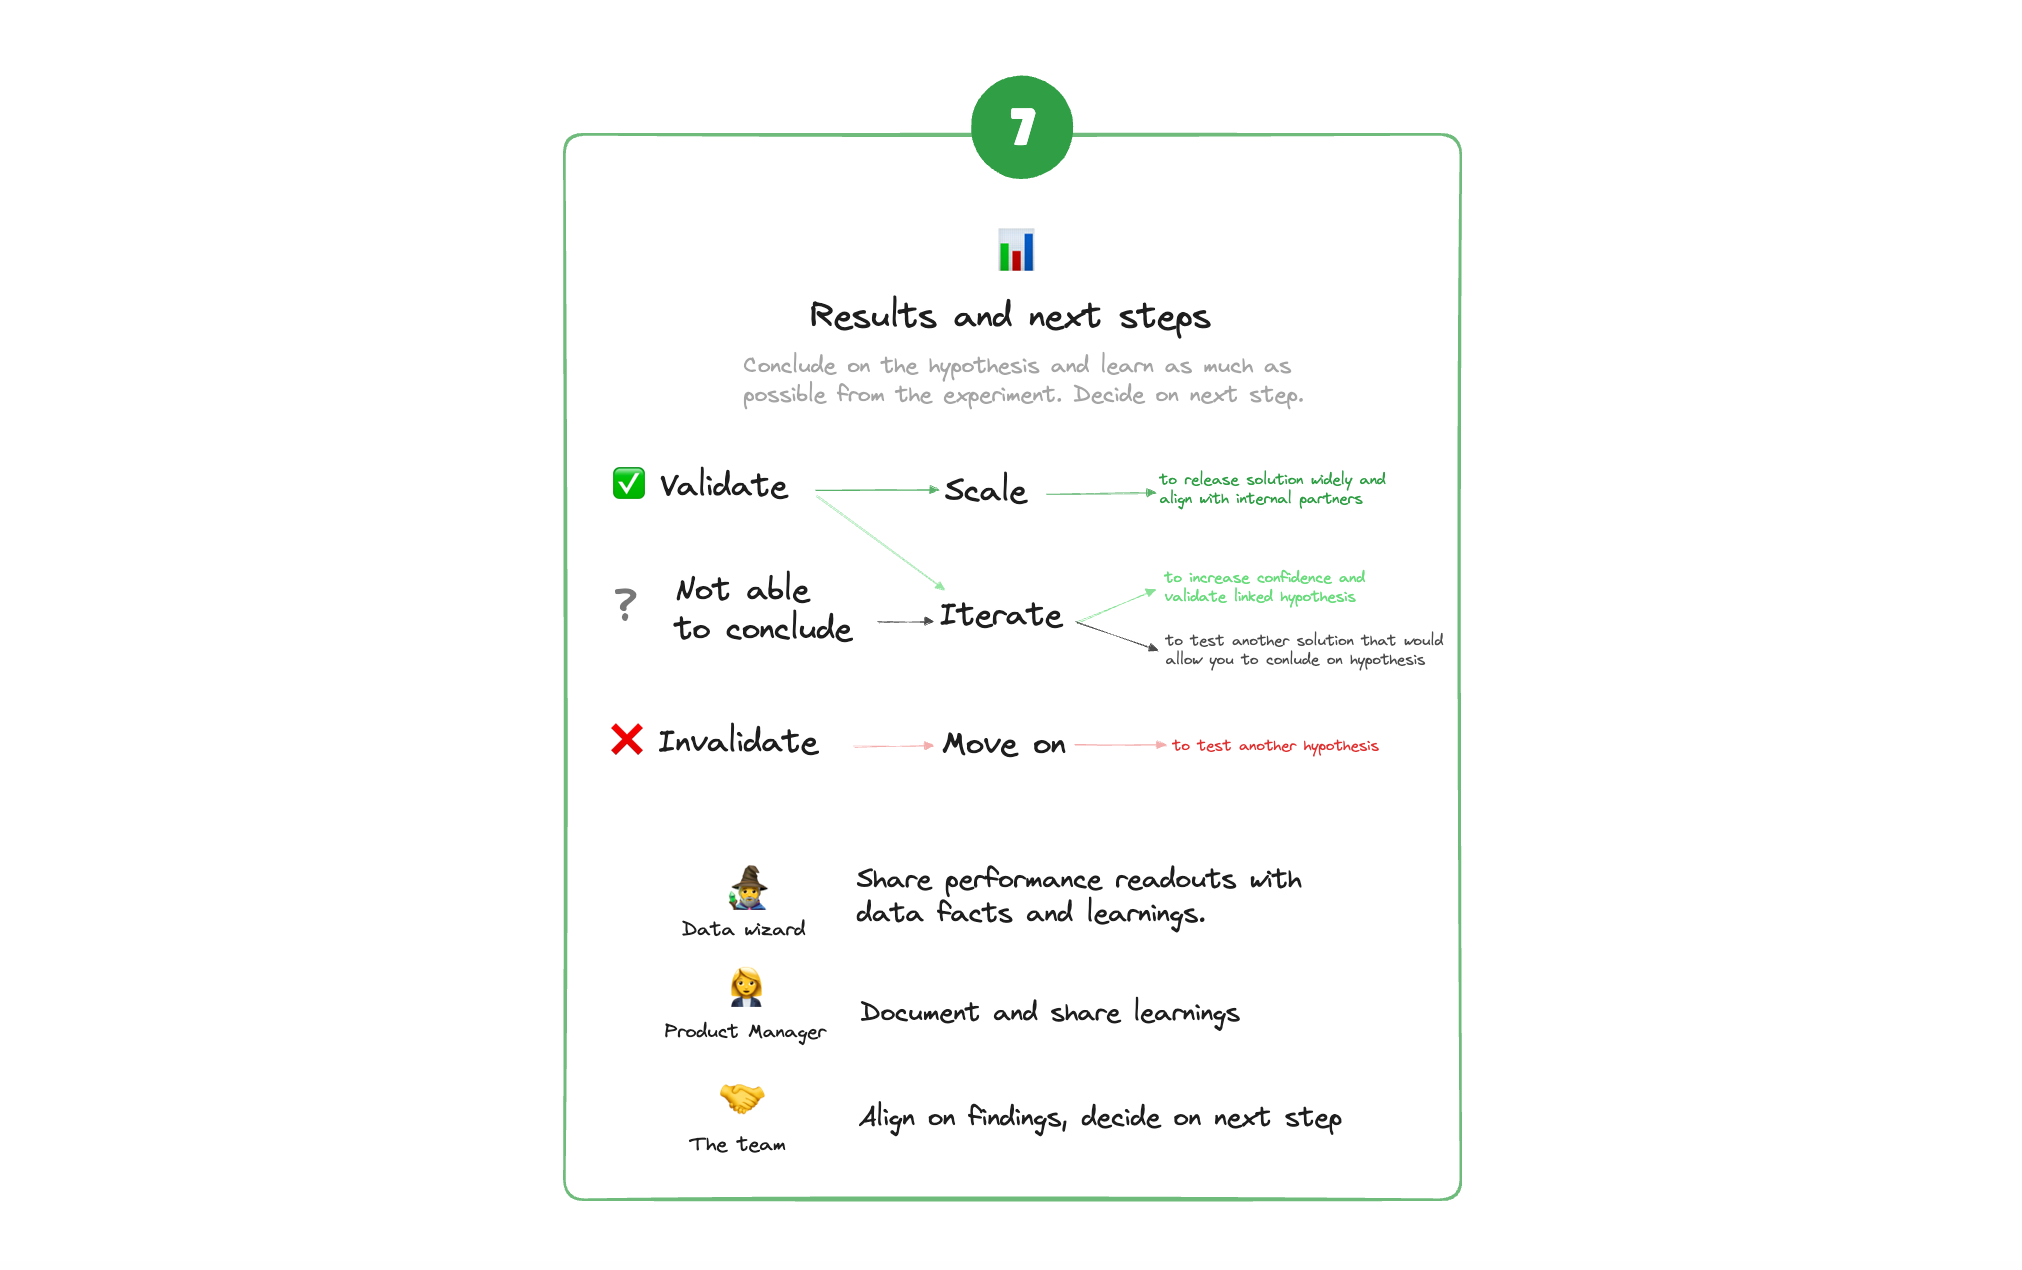
The Data Informed Experimentation System
There’s theory and there’s practice!
When I tried to apply the Thoughtful Execution Tree I faced many hurdles so here’s how I applied it and enriched it with detailed steps, roles and responsibilities based on my experience as a Product Data Analyst.
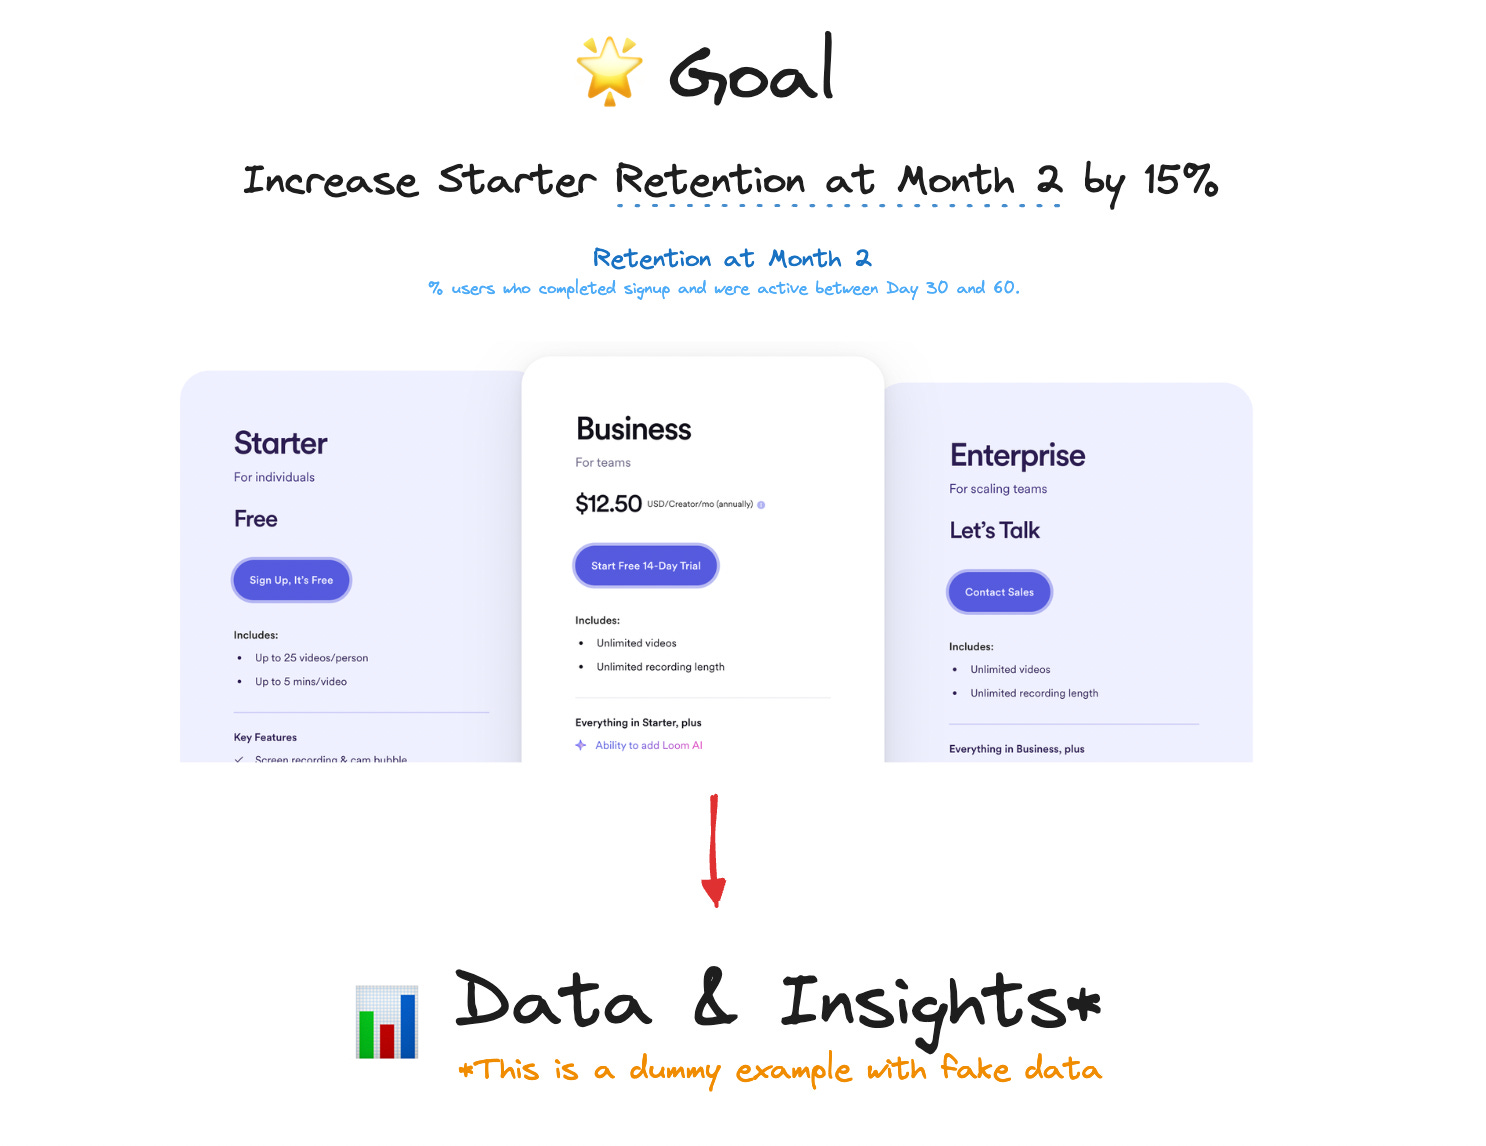
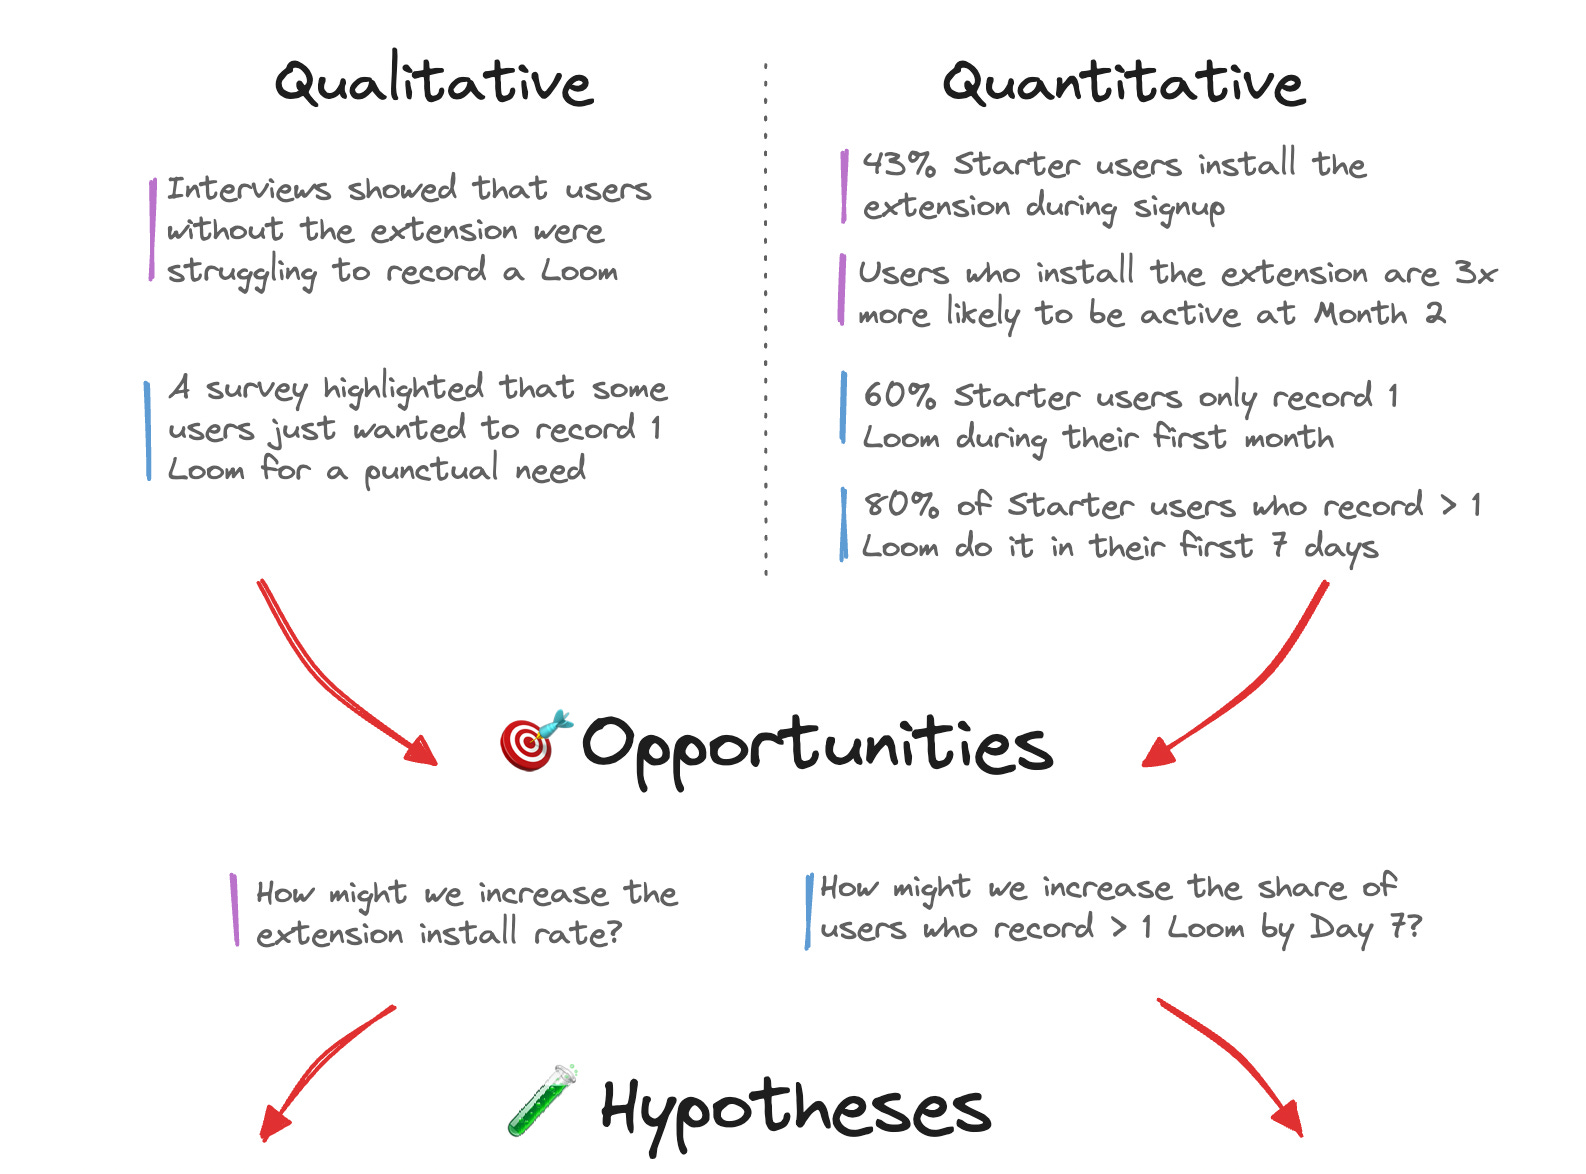
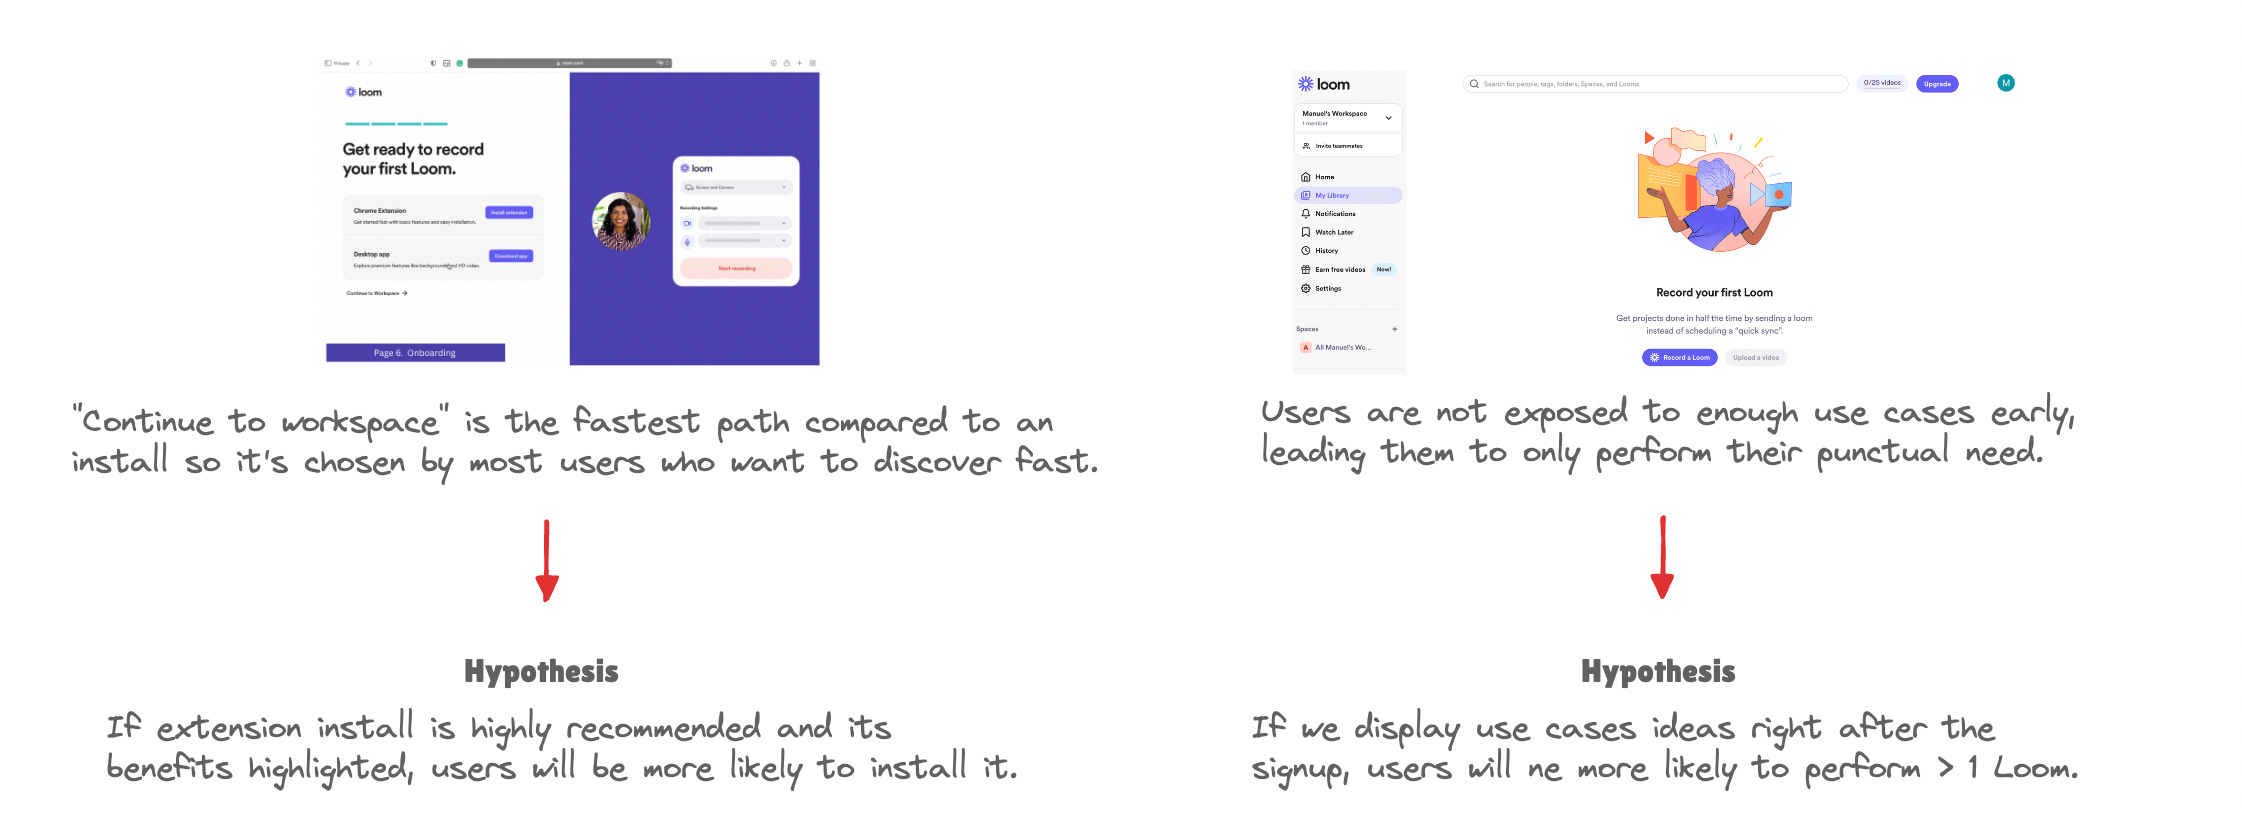
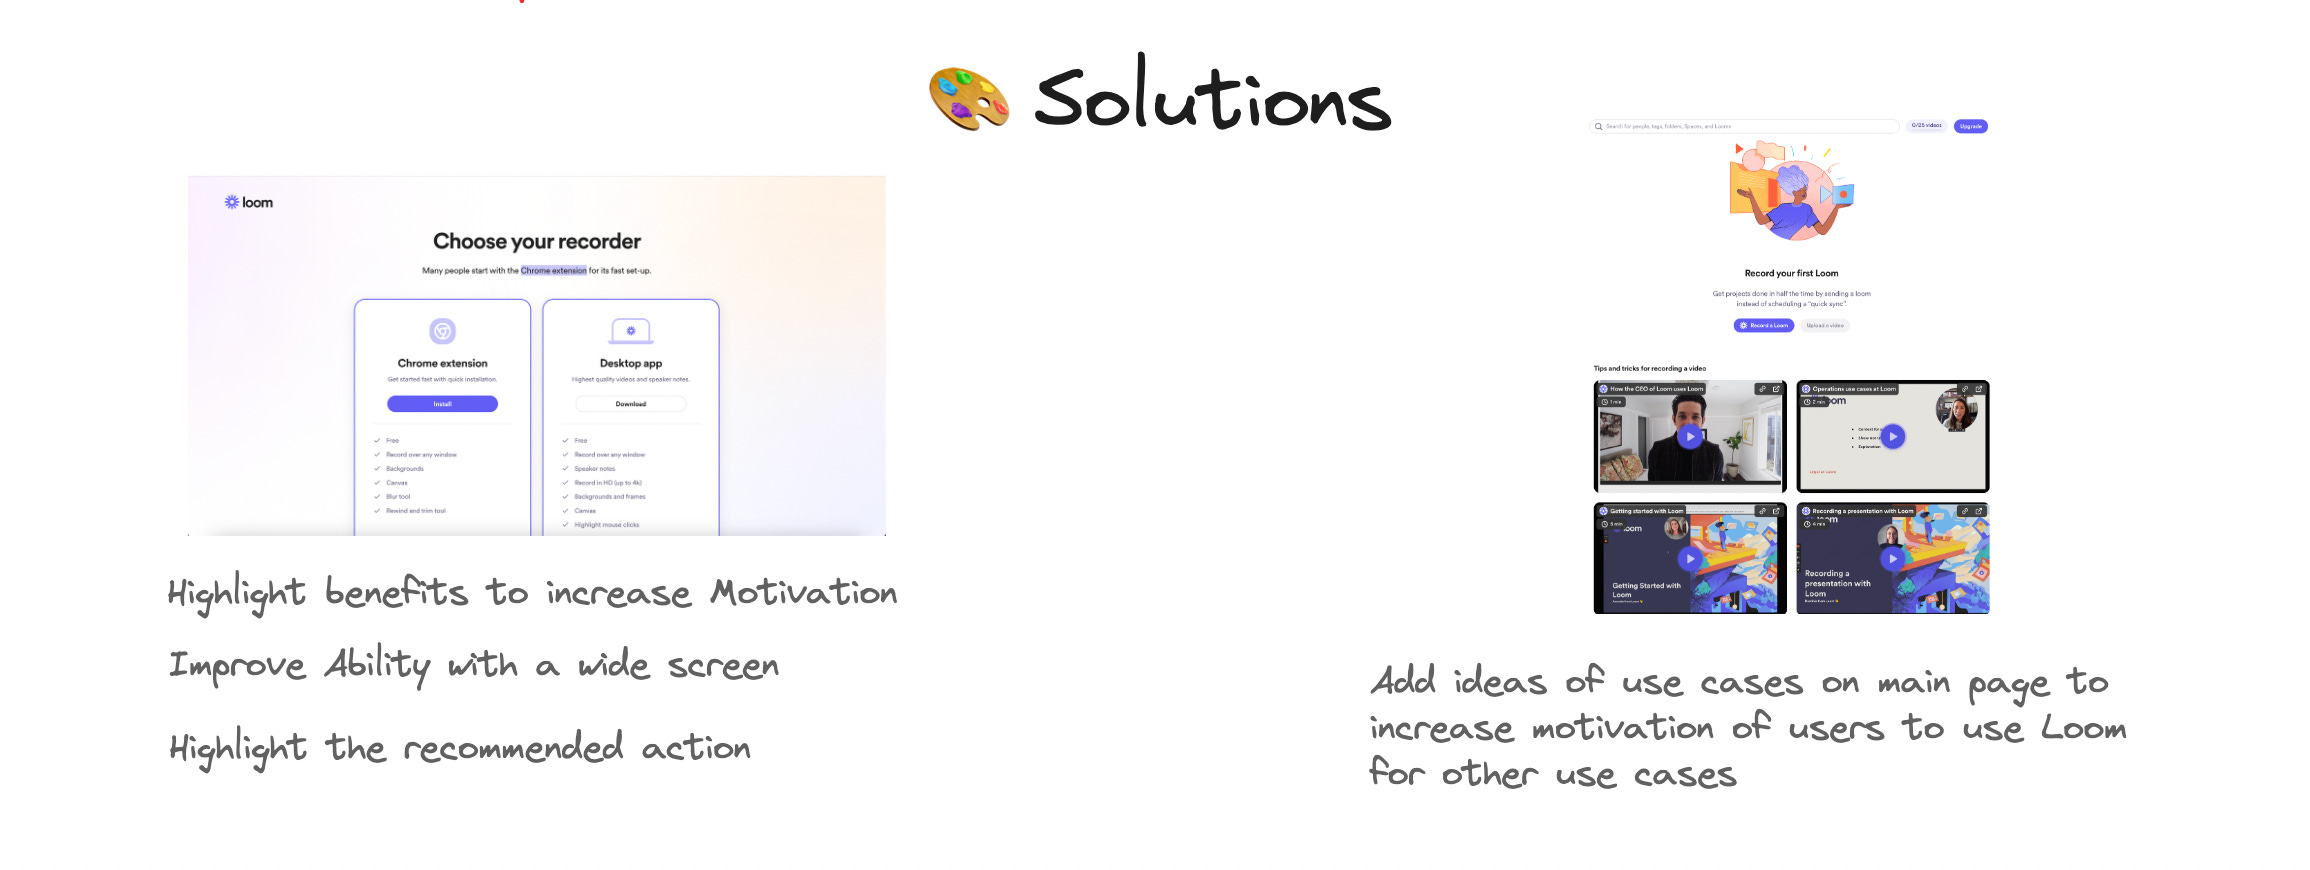
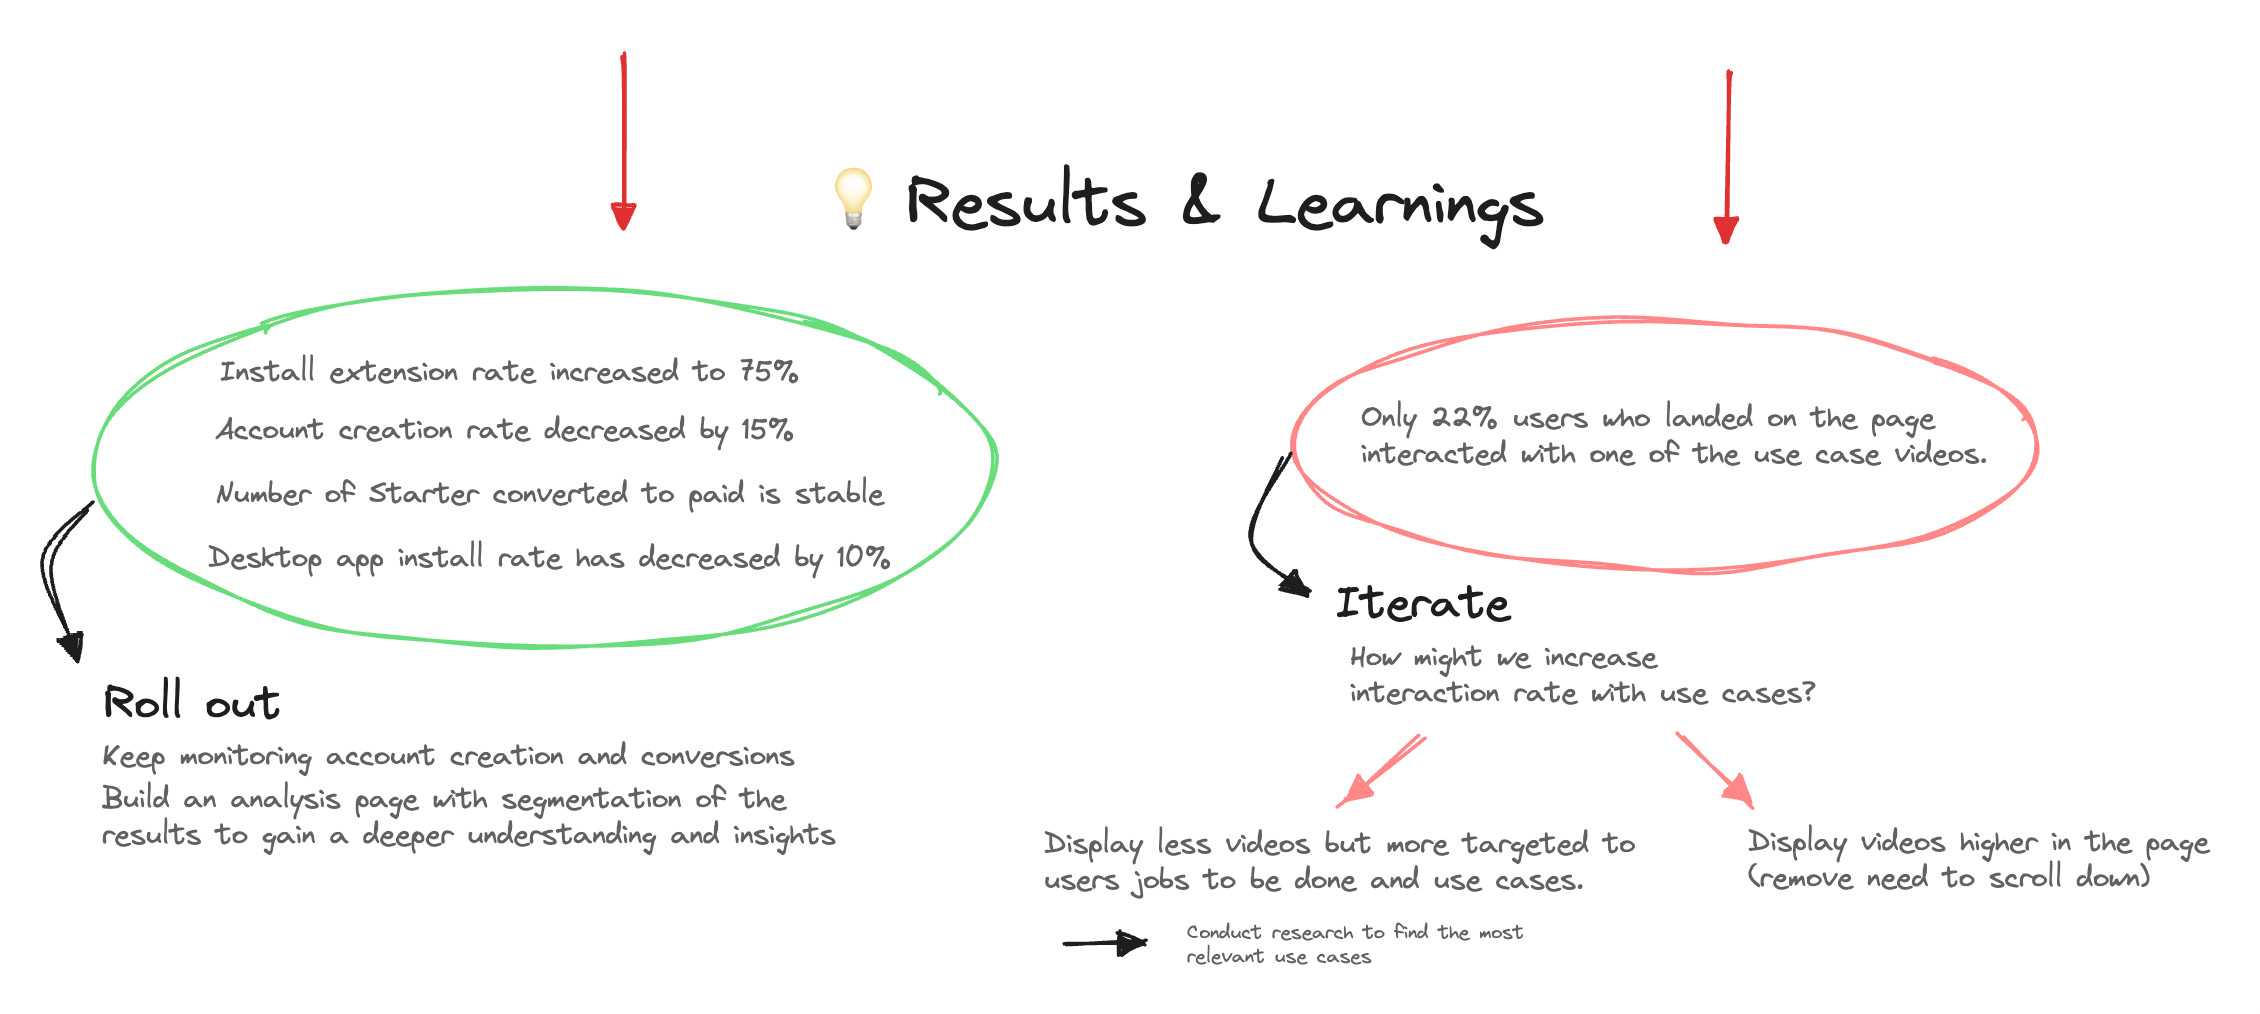
Let’s take an example
Based on dummy data, the purpose is just to illustrate the process
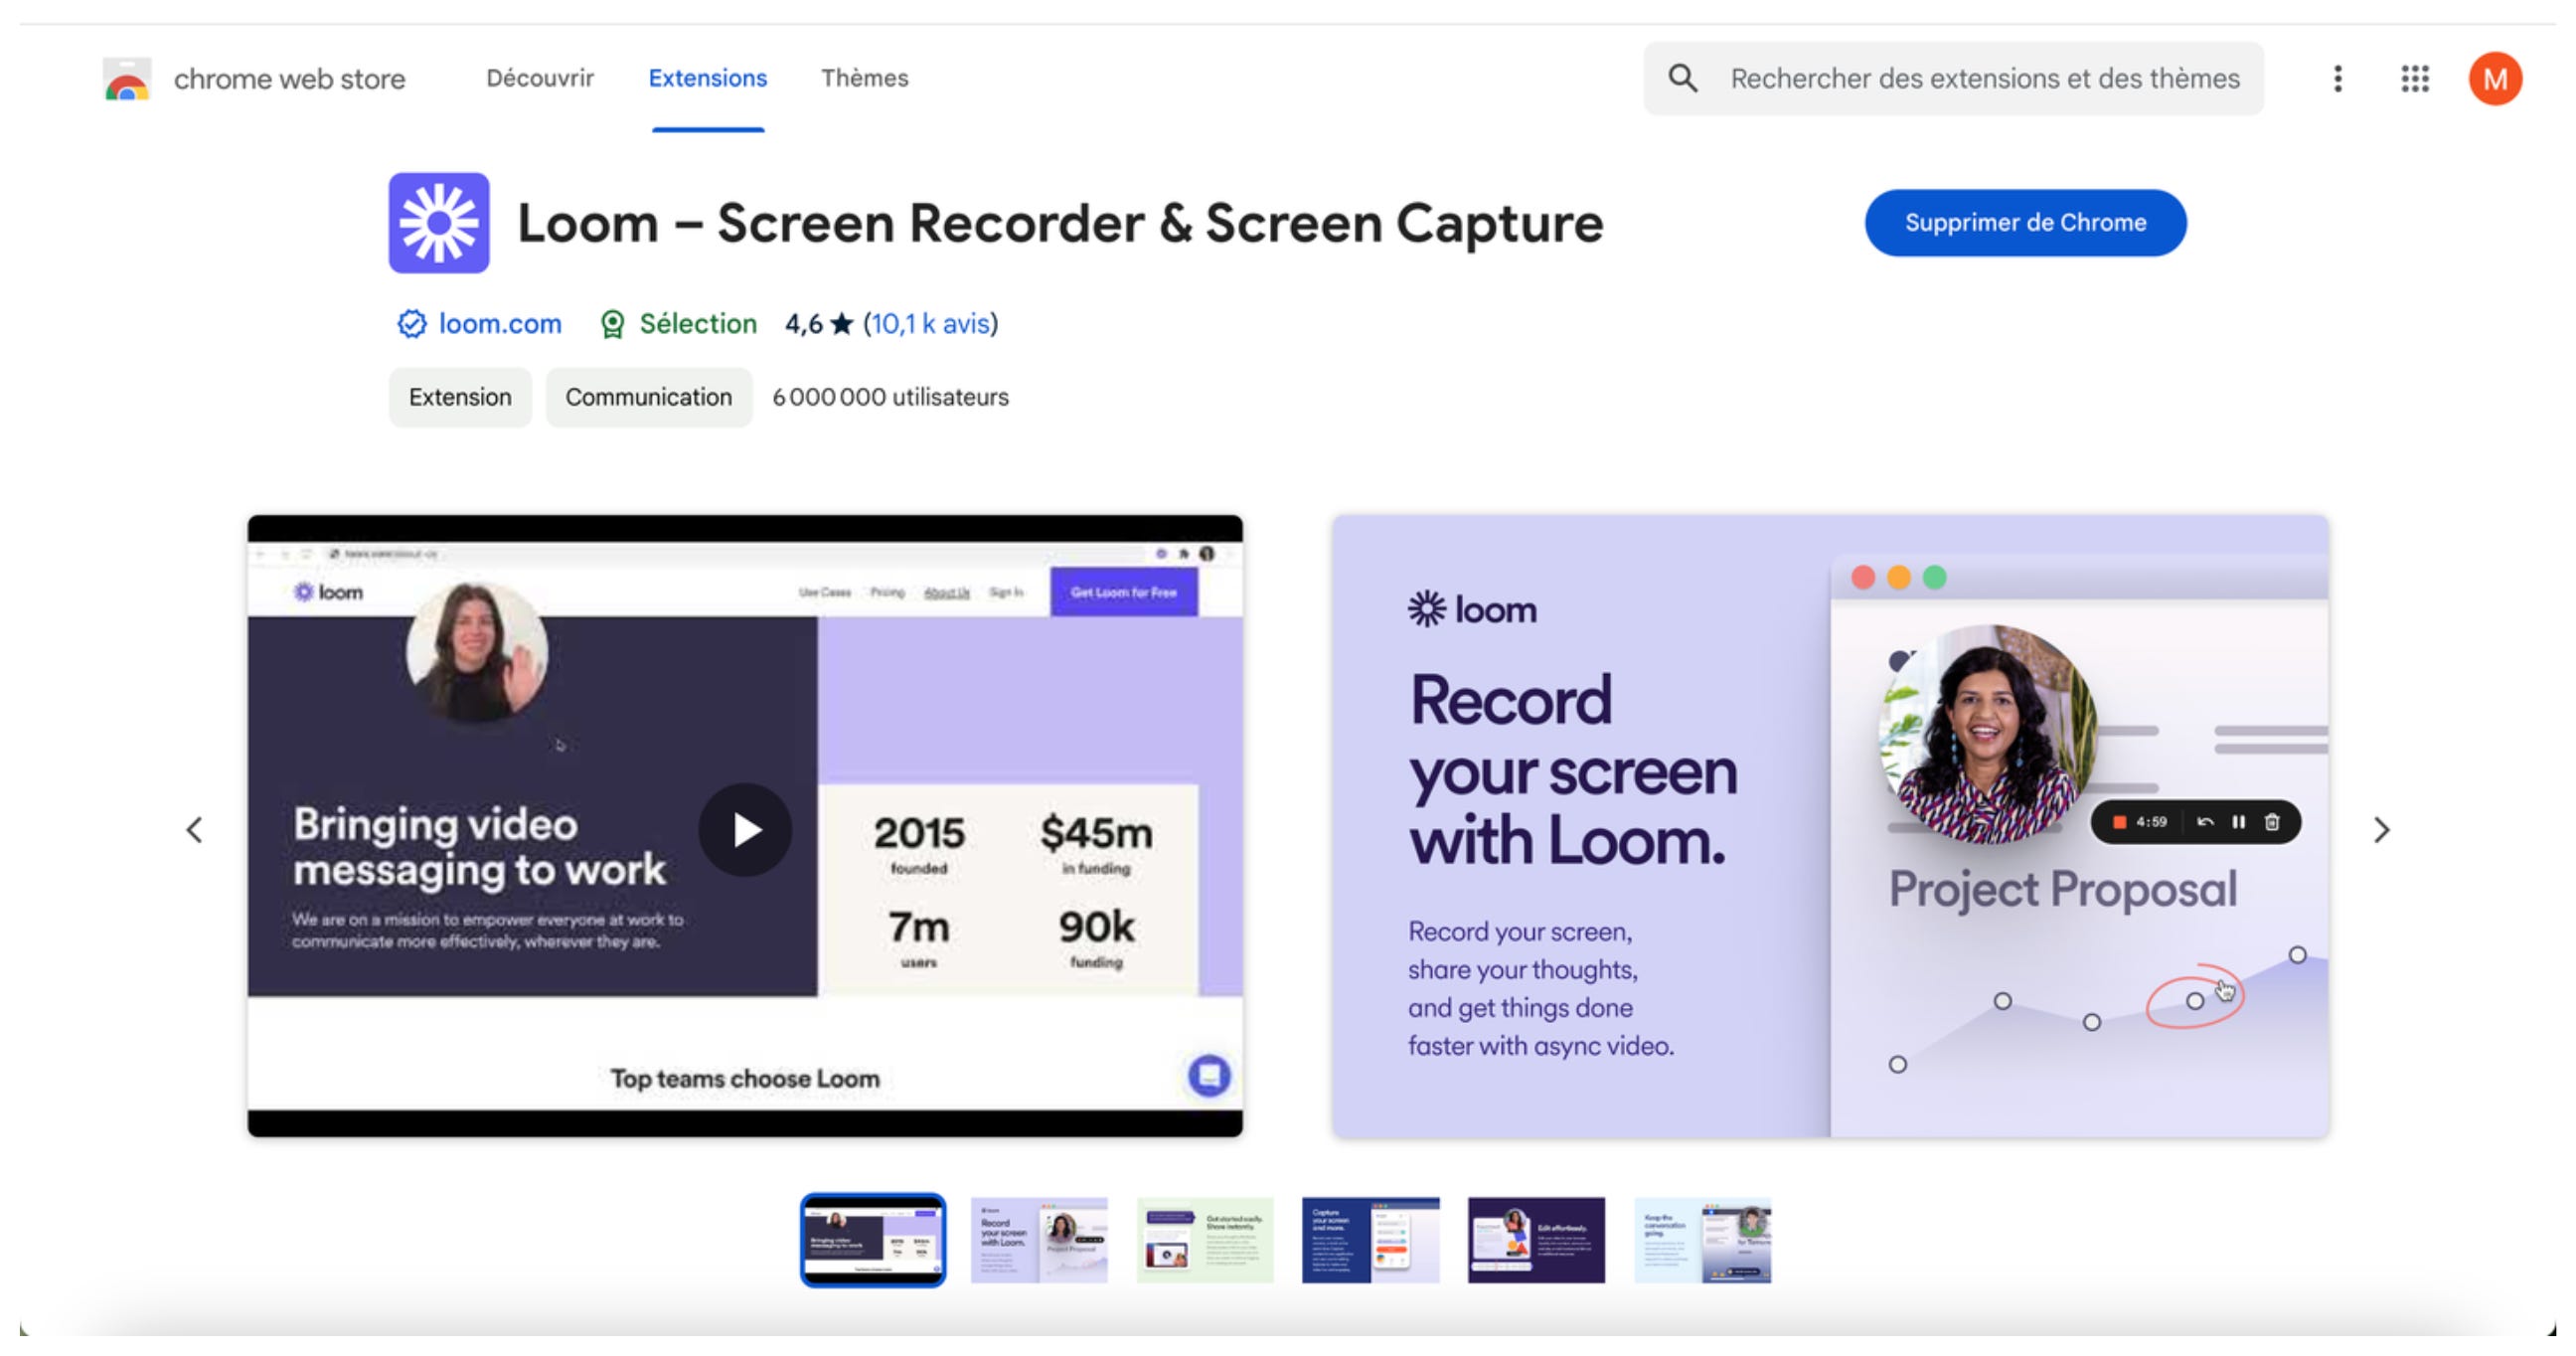
Imagine we are working in a growth team at Loom, a successful B2B and B2C SaaS that was recently acquired by Atlassian for $975M. Loom is an improved screen recorder which allows you to record your screen while recording yourself in a moving bubble on top of your screen.
Let’s imagine Loom spotted an opportunity to increase Starter retention. Based on pre-existing data they notice that most Starter users who become inactive drop by week 1.
The Toolbox
Now that we have an Experimentation System, we can dive deeper into the concepts that will make it efficient.
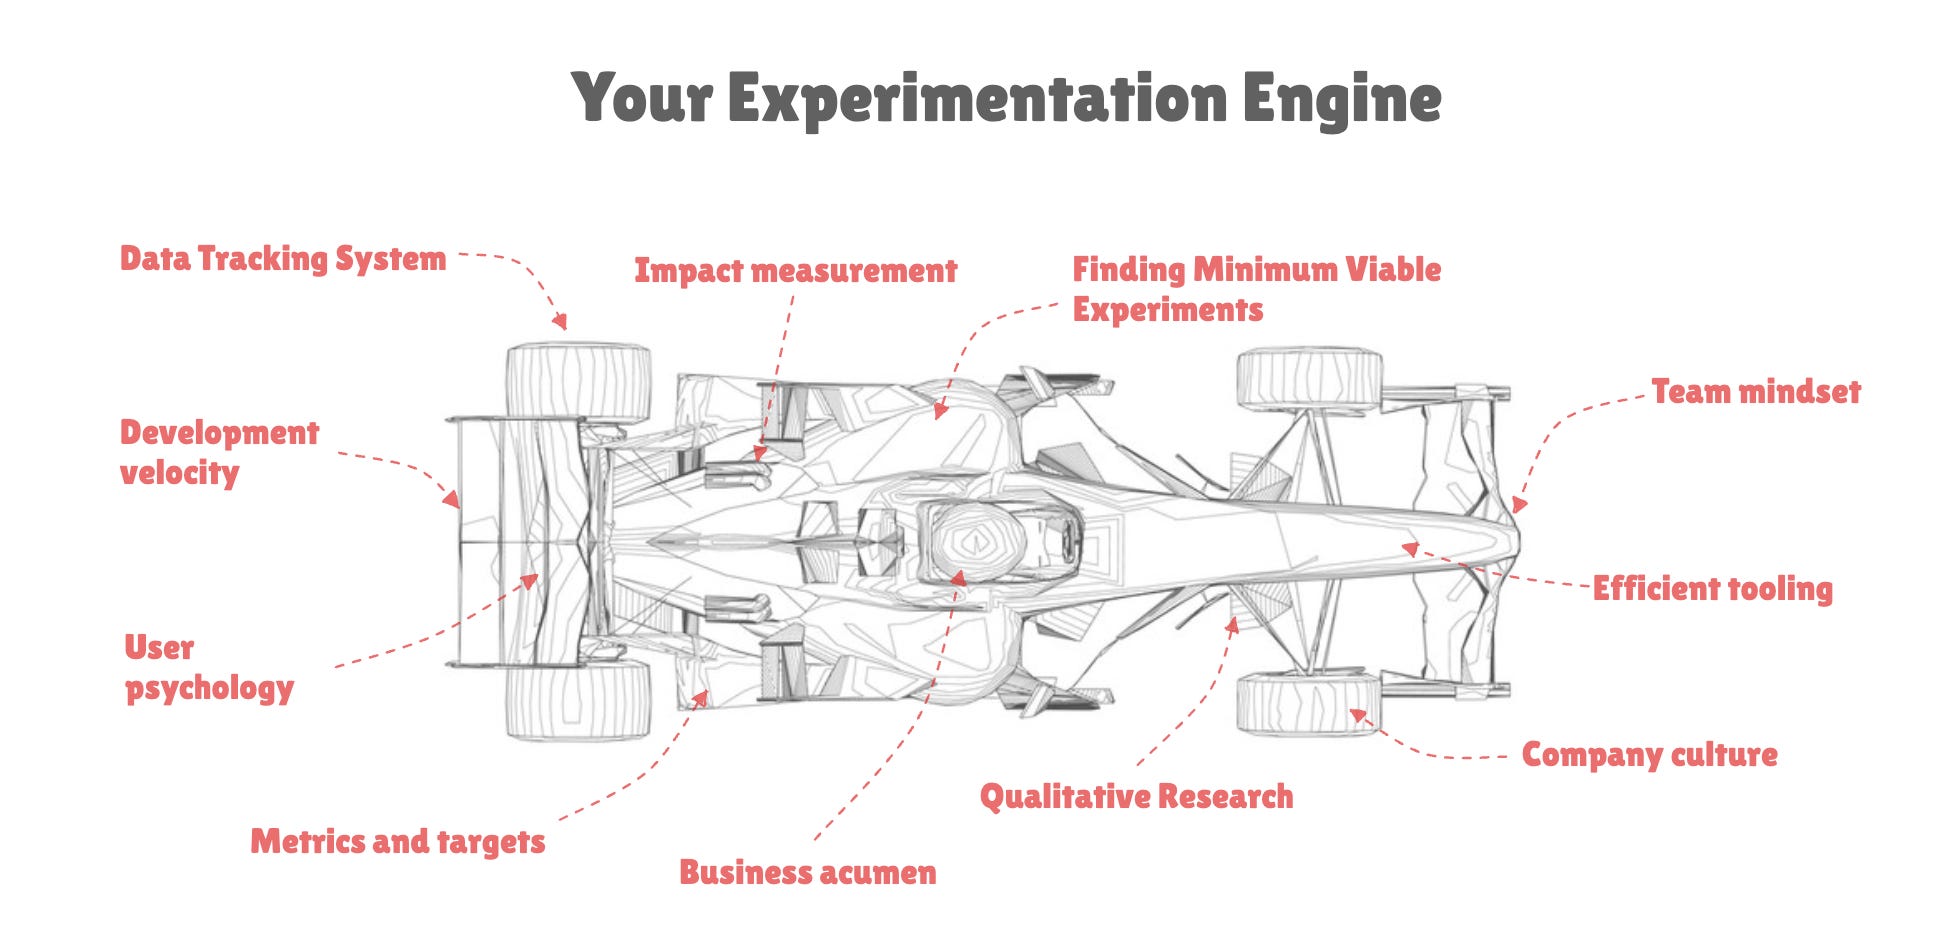
Systems are great as they provide both a high level view and detailed relationships between elements. Just like a Formula 1 car you can break it down into pieces, improve them separately then make them work together harmoniously.
The Minimum Viable Experiment
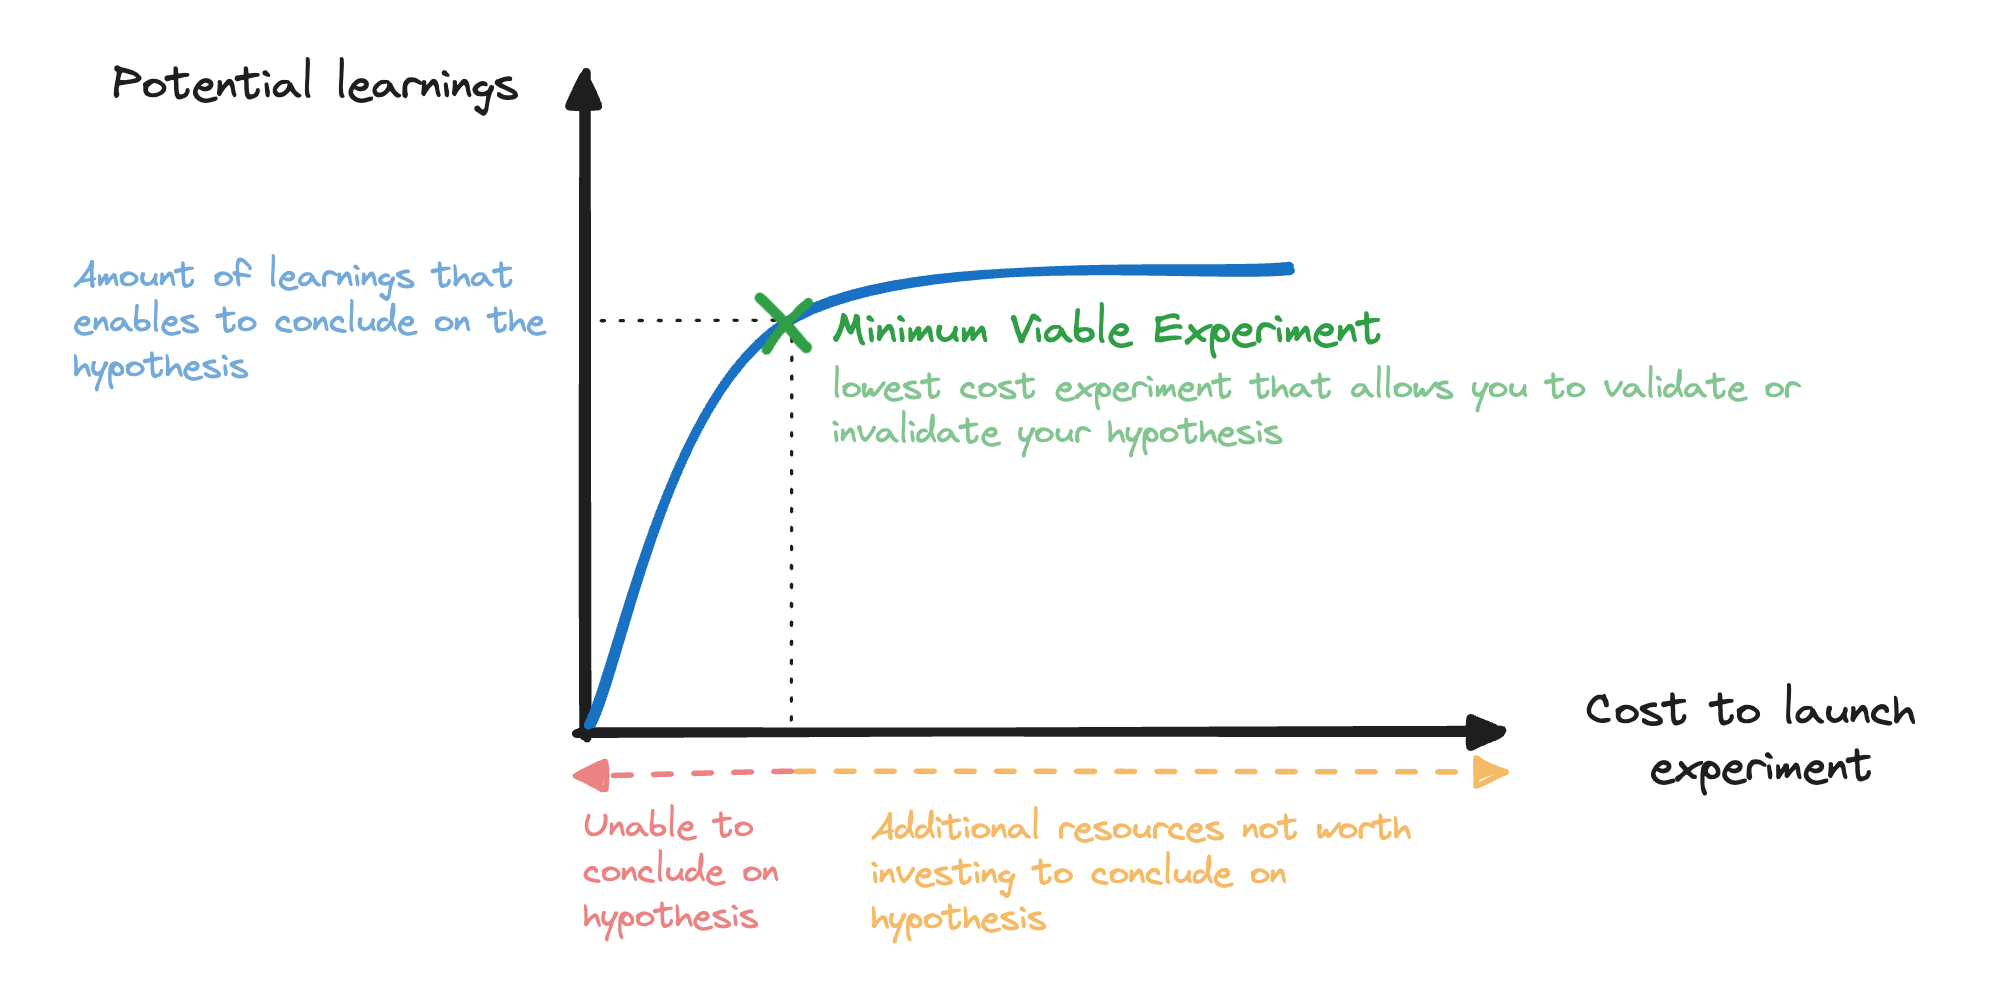
The purpose of the Experimentation System is to enable product teams to launch Minimum Viable Experiments (MVEs) so that they validate and reject hypotheses at a fast pace and learn new insights.
An MVE is the lowest cost experiment that allows you to validate or invalidate a hypothesis.
For instance, if you want to learn about the potential interest of a new feature in your product you could:
Develop it fully for weeks then measure its adoption.
Create a fake door test in 1 day then measure clicks.
Create a fake door test in 2-3 days with a quick survey triggered on click to learn about why users are interested.
Option 1 is a very risky bet. Option 2 might be an MVE but it might also not be enough to conclude on your hypothesis. Option 3 is a very efficient MVE from which you can learn a lot.
How to experiment
First let’s not mix up experimentation and A/B Testing. It is one of the methods that can help you conduct a certain type of experiment, that’s all.
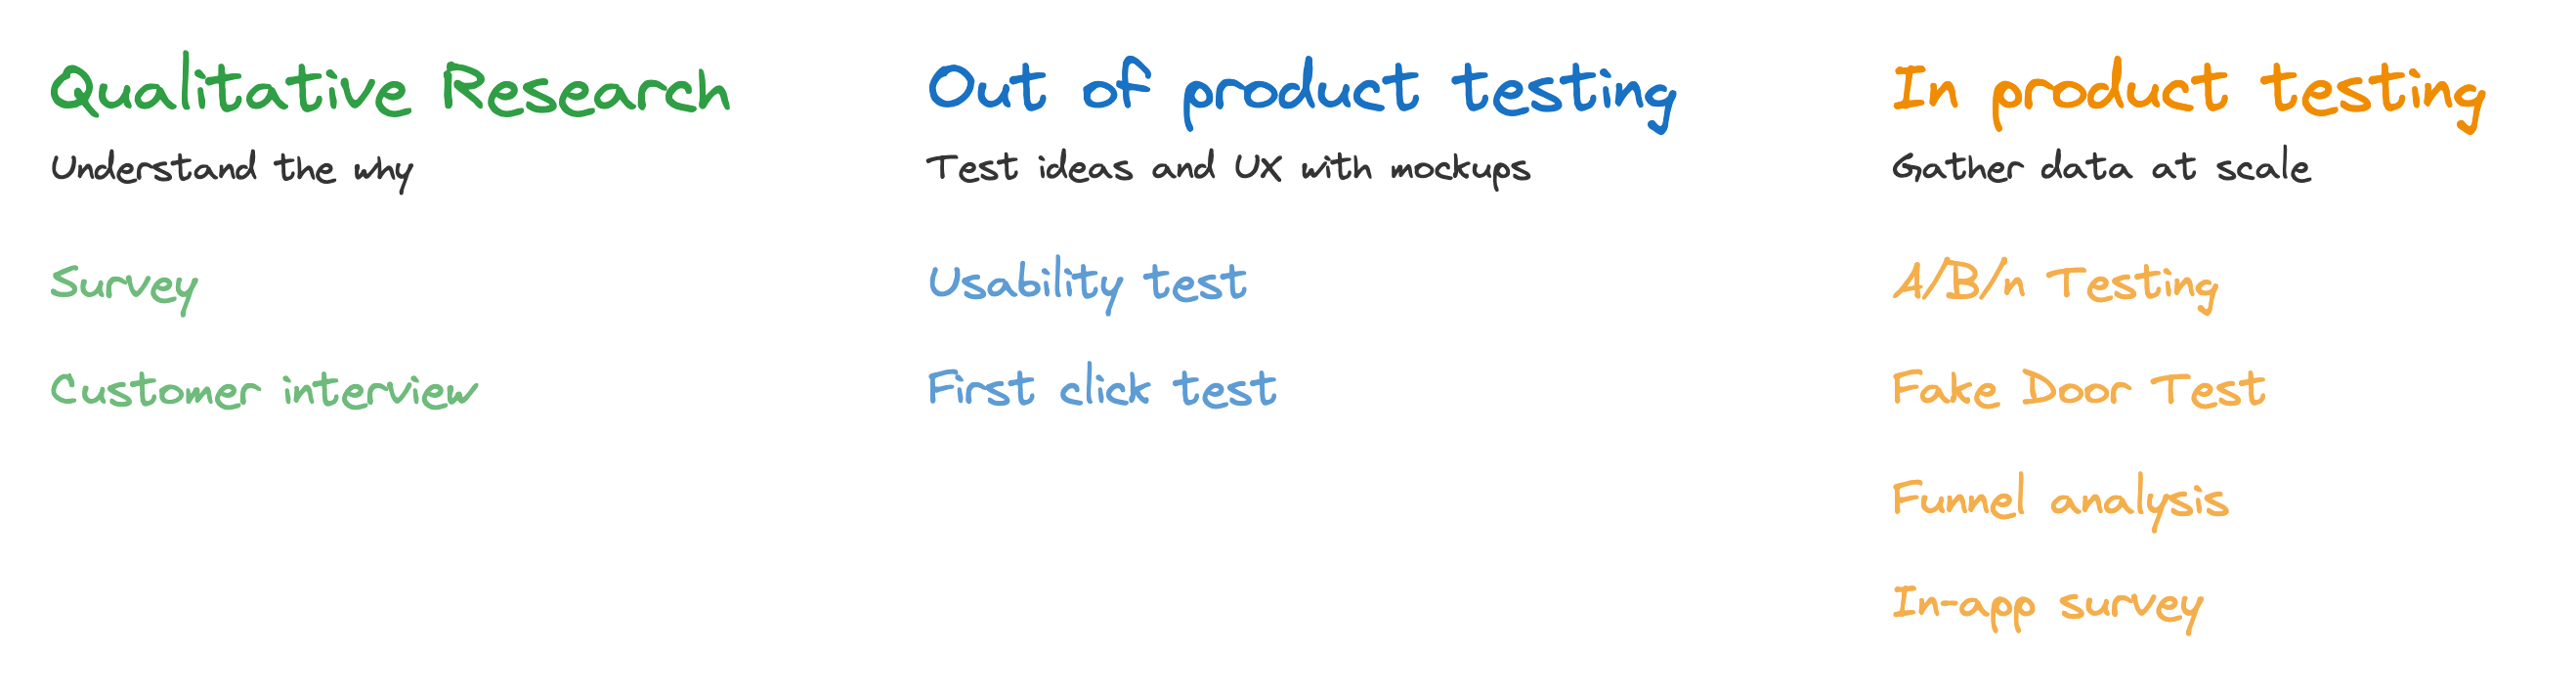
Research
Can be either generative (understand user needs to identify opportunities) or evaluative (measuring outcomes of an initiative).
Out of product testing
It is about gathering feedbacks and insights from ideas before investing in any technical effort. It could be as simple as leveraging a Figma with a few users to see how they react.
In product testing
It is about gathering data at scale by leveraging data tracking in the product directly. The product itself is a way to interact with active customers and understand what they want.
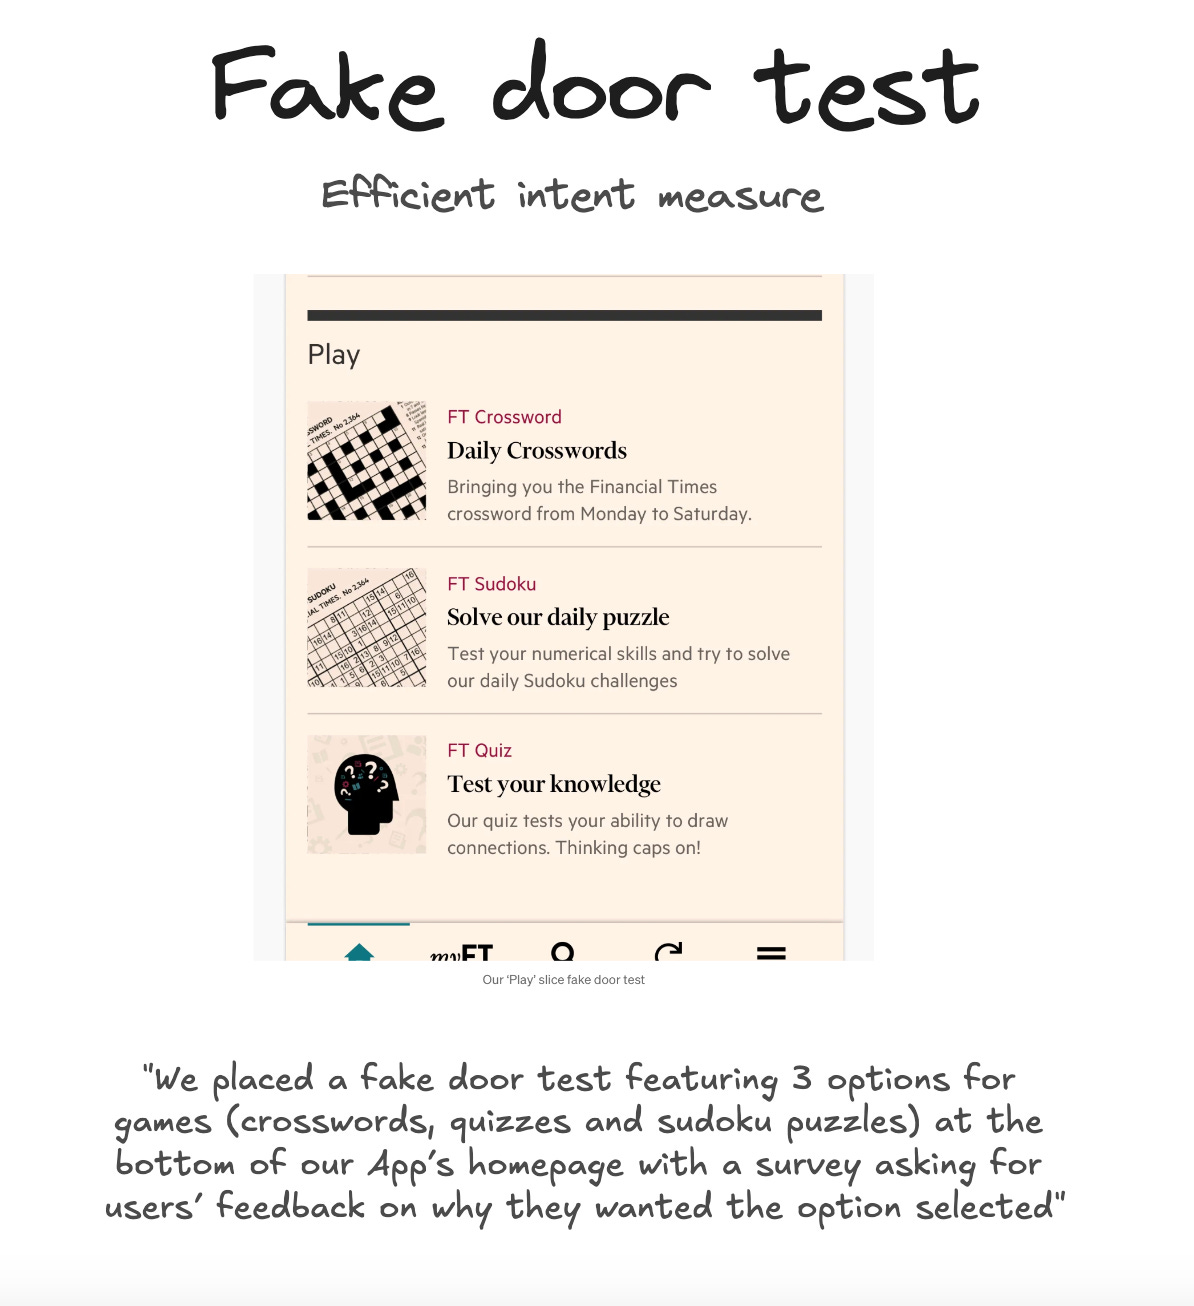
Fake Door Test is a method to measure user interest in a potential feature by presenting it as available and tracking engagement, without fully developing it (Example from The Financial Times).
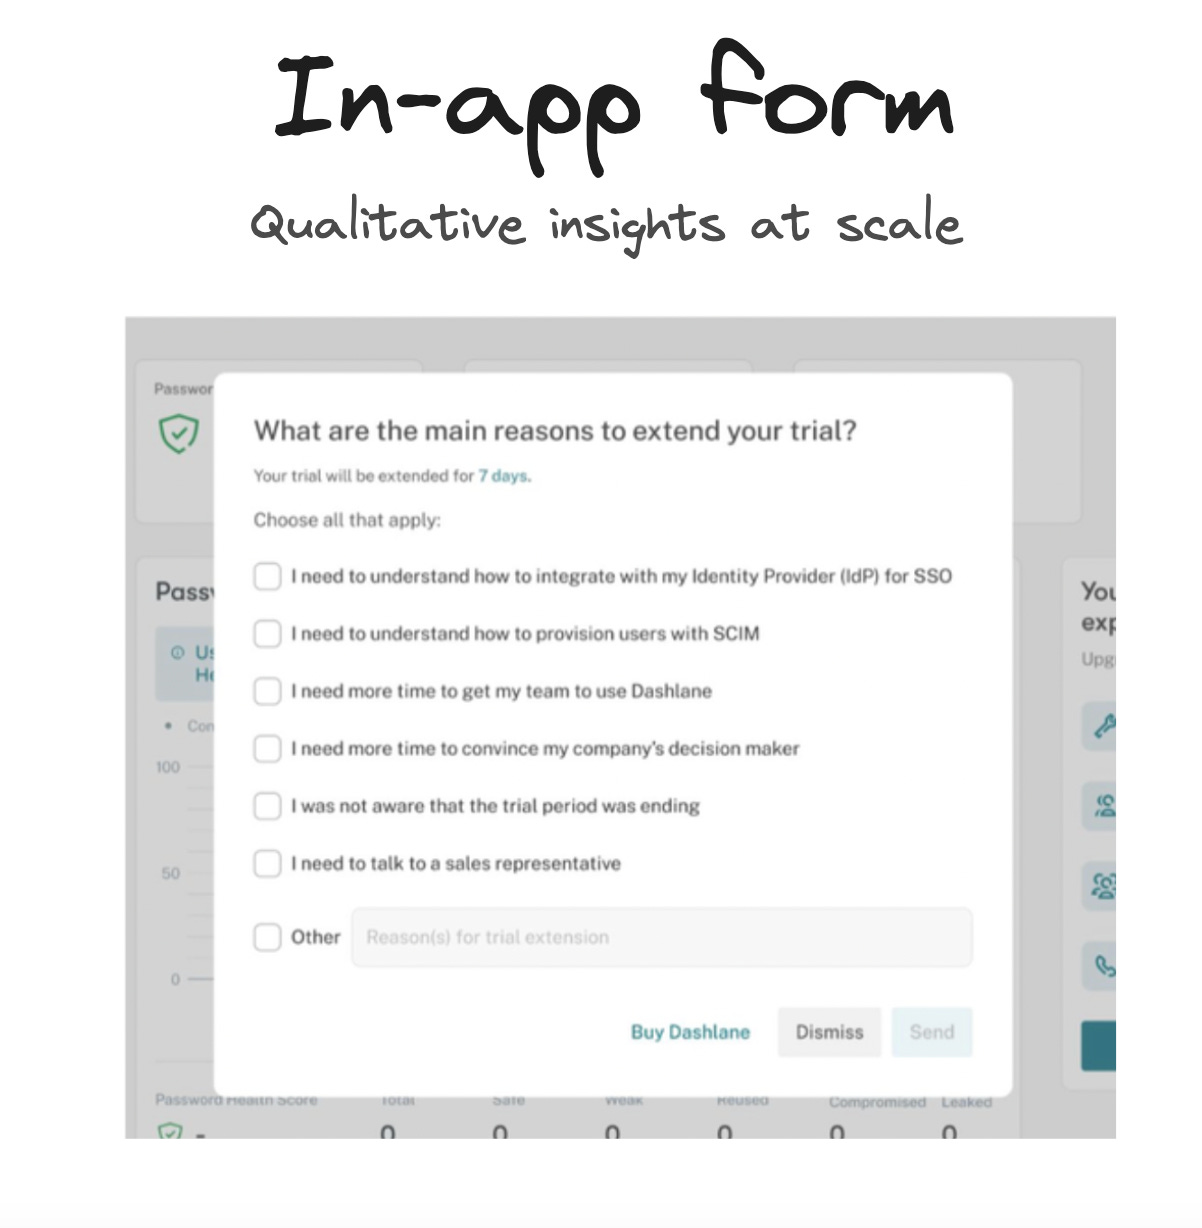
In-app Forms provide answers from customers at specific moments in their lifecycle or at specific places in the product. Leverage it to inform product customisation, marketing campaigns or to unravel churn reasons.
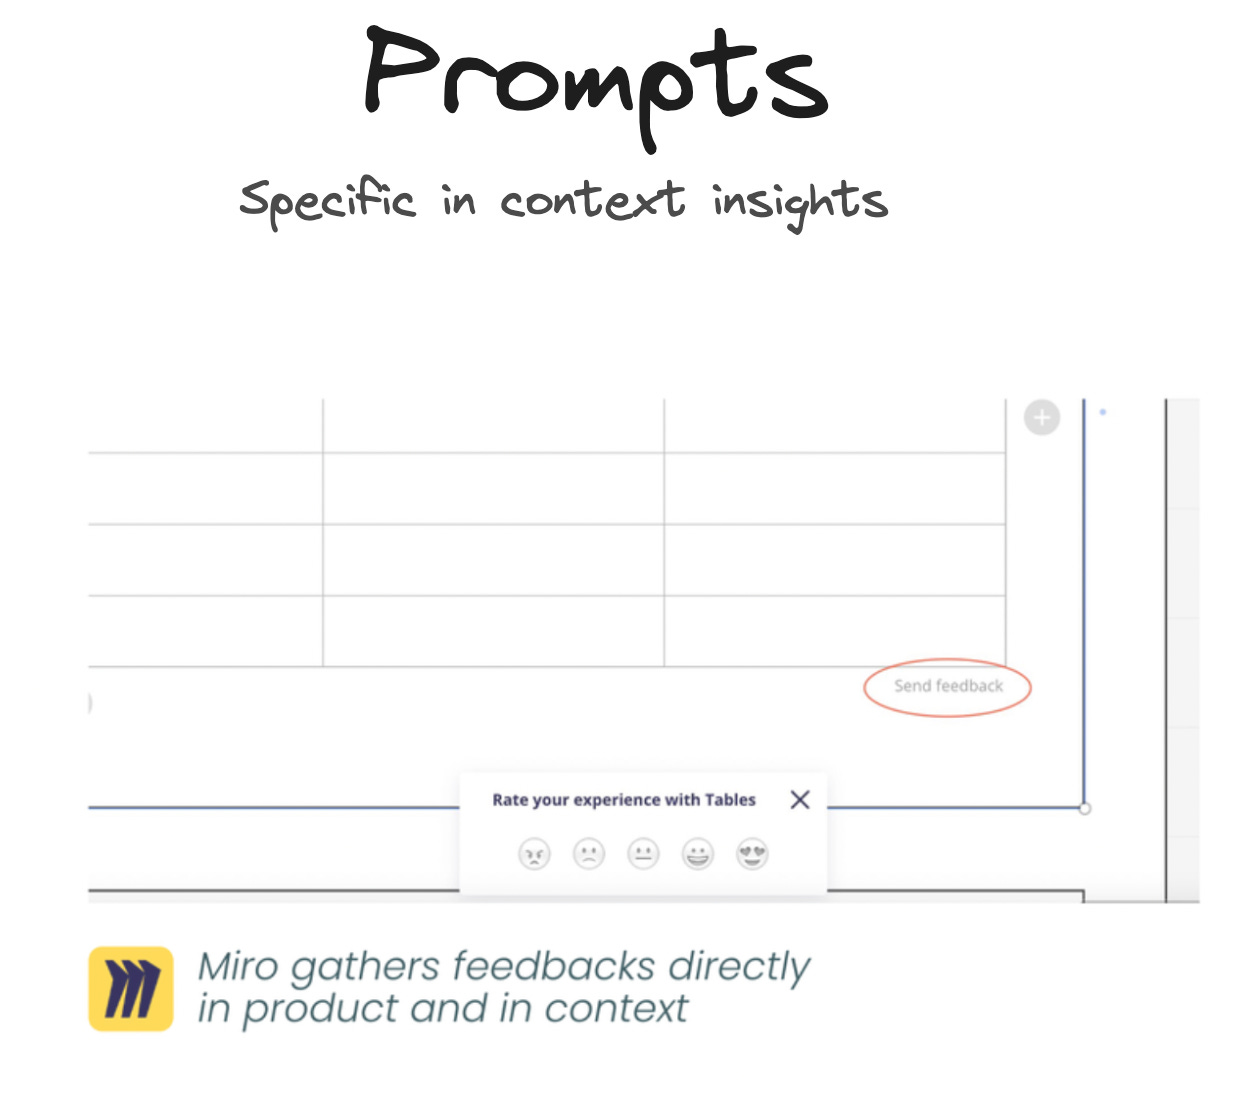
In-app Prompts give you quick feedbacks in context, to rate a feature or ask customers to perform an action at the right time.
How to find a good measurable goal
A good goal should be specific, measurable, achievable, realistic and time-bound (yes the famous SMART acronym).
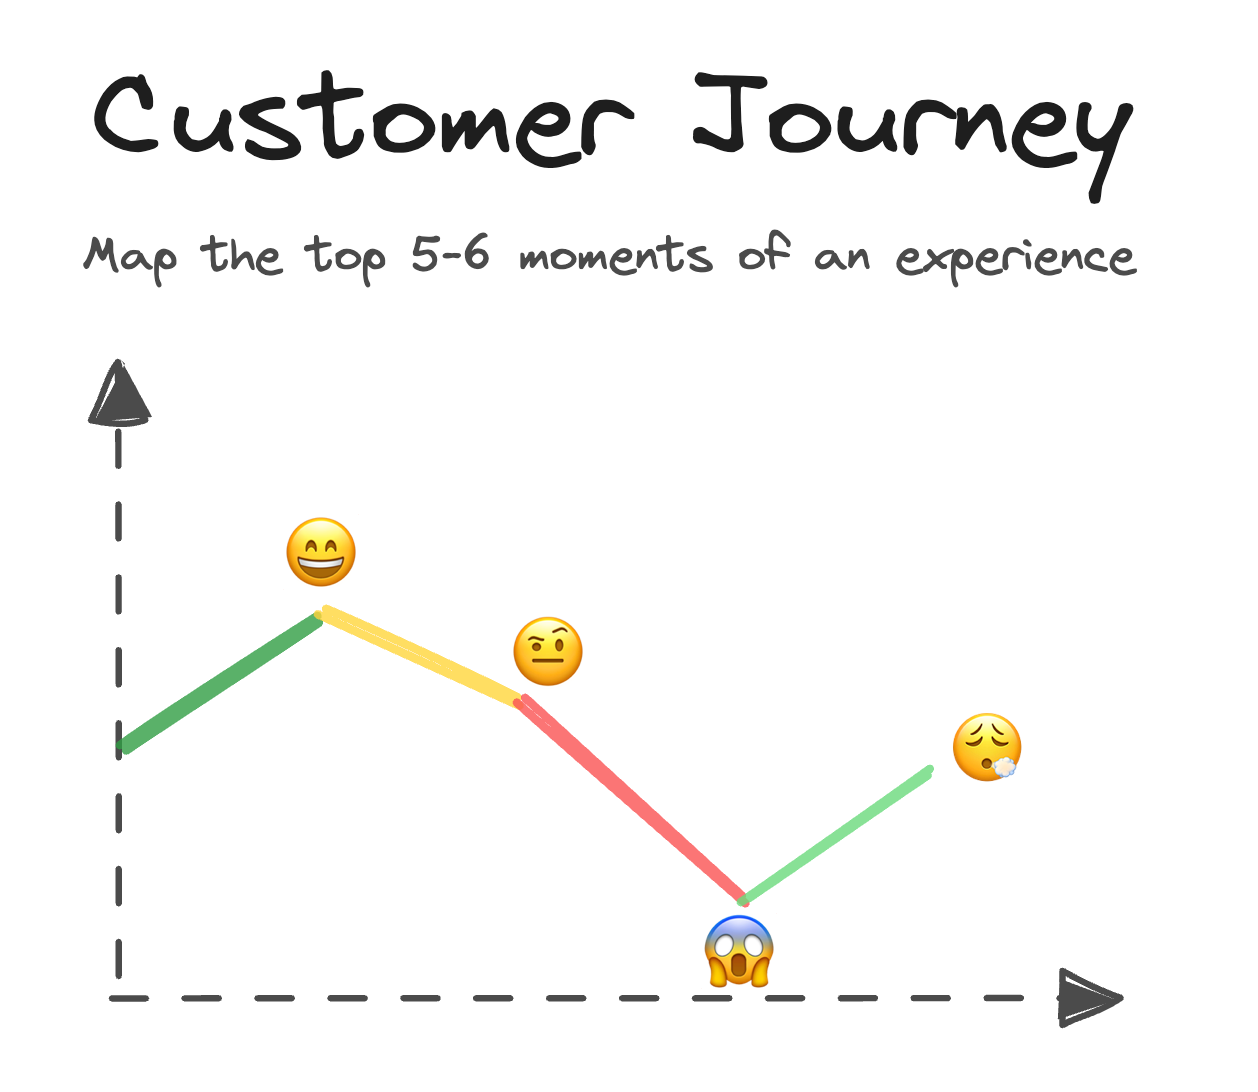
Map the top 5-6 moments of the Customer journey you’re working on. Enrich it with qualitative and quantitative insights and identify potential drop-offs to reduce or important moments to elevate even further.
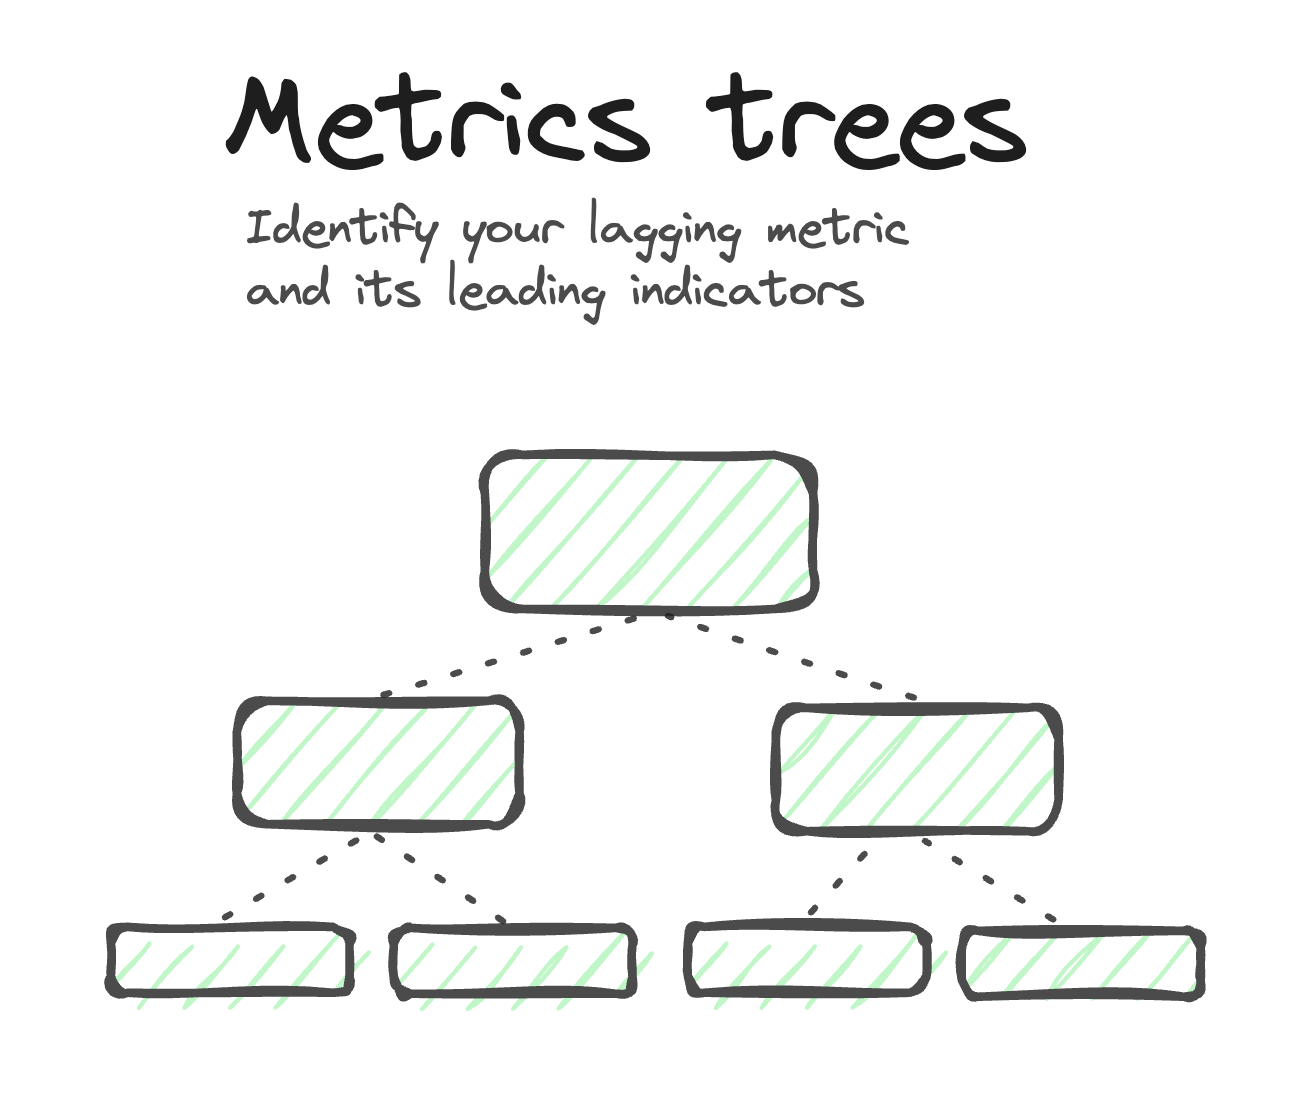
Build a Metrics Tree, with the North Star Metric being the lagging indicator you’re trying to optimise (ex: trial conversion rate). Break down the North Star into leading indicators (ex: product behaviours) you can directly influence.
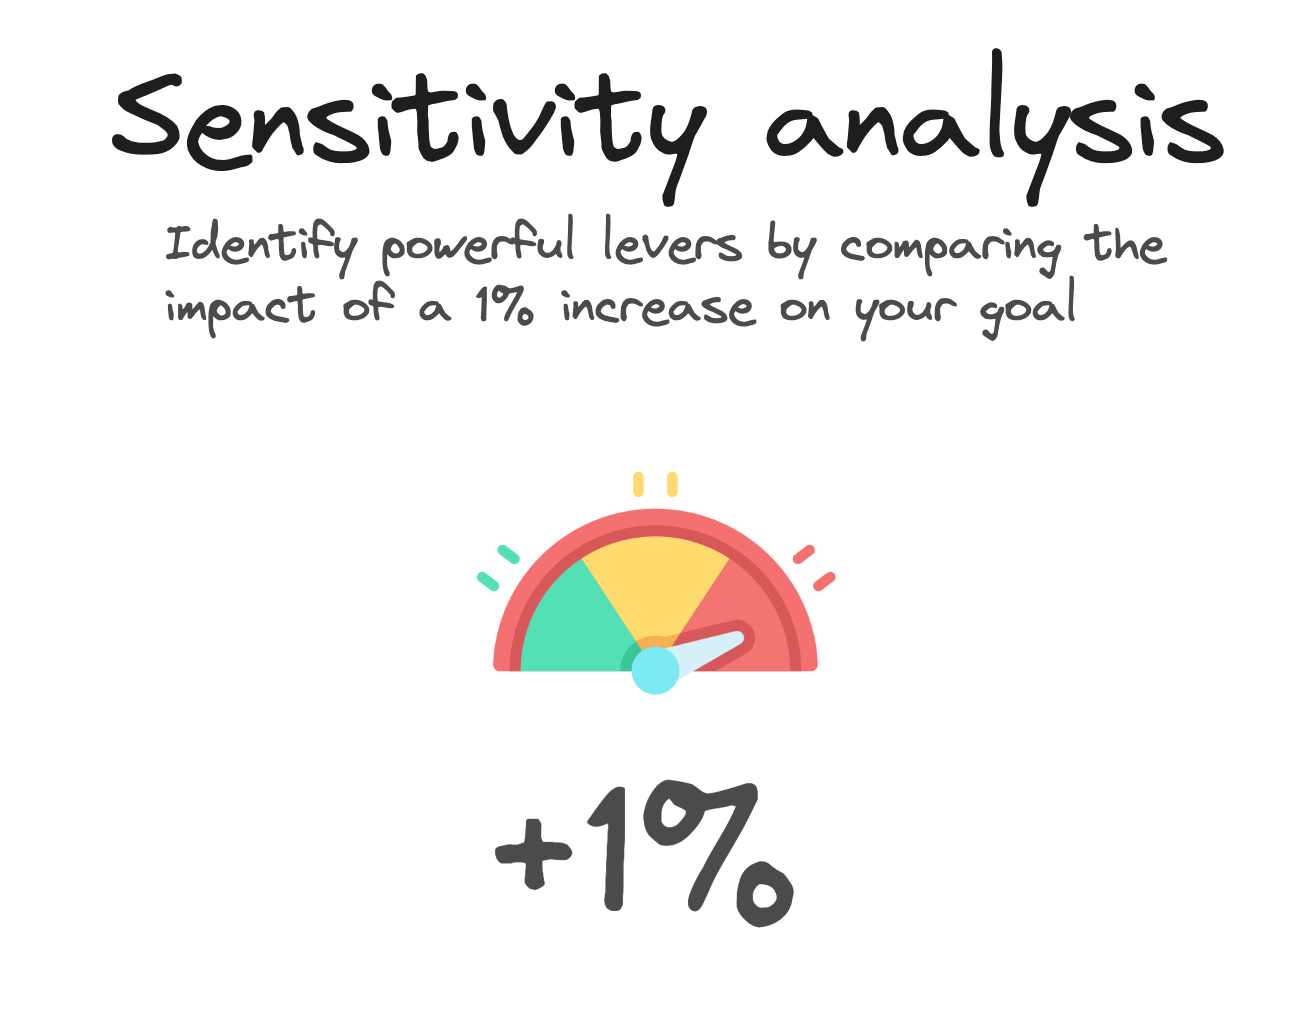
Perform a Sensitivity Analysis to quantify the relative impact of levers at your disposal: what would a 1 unit increase mean? For instance if you have seat based pricing for your B2B offer, you need to know the potential impact of selling more seats vs increasing price per seat.
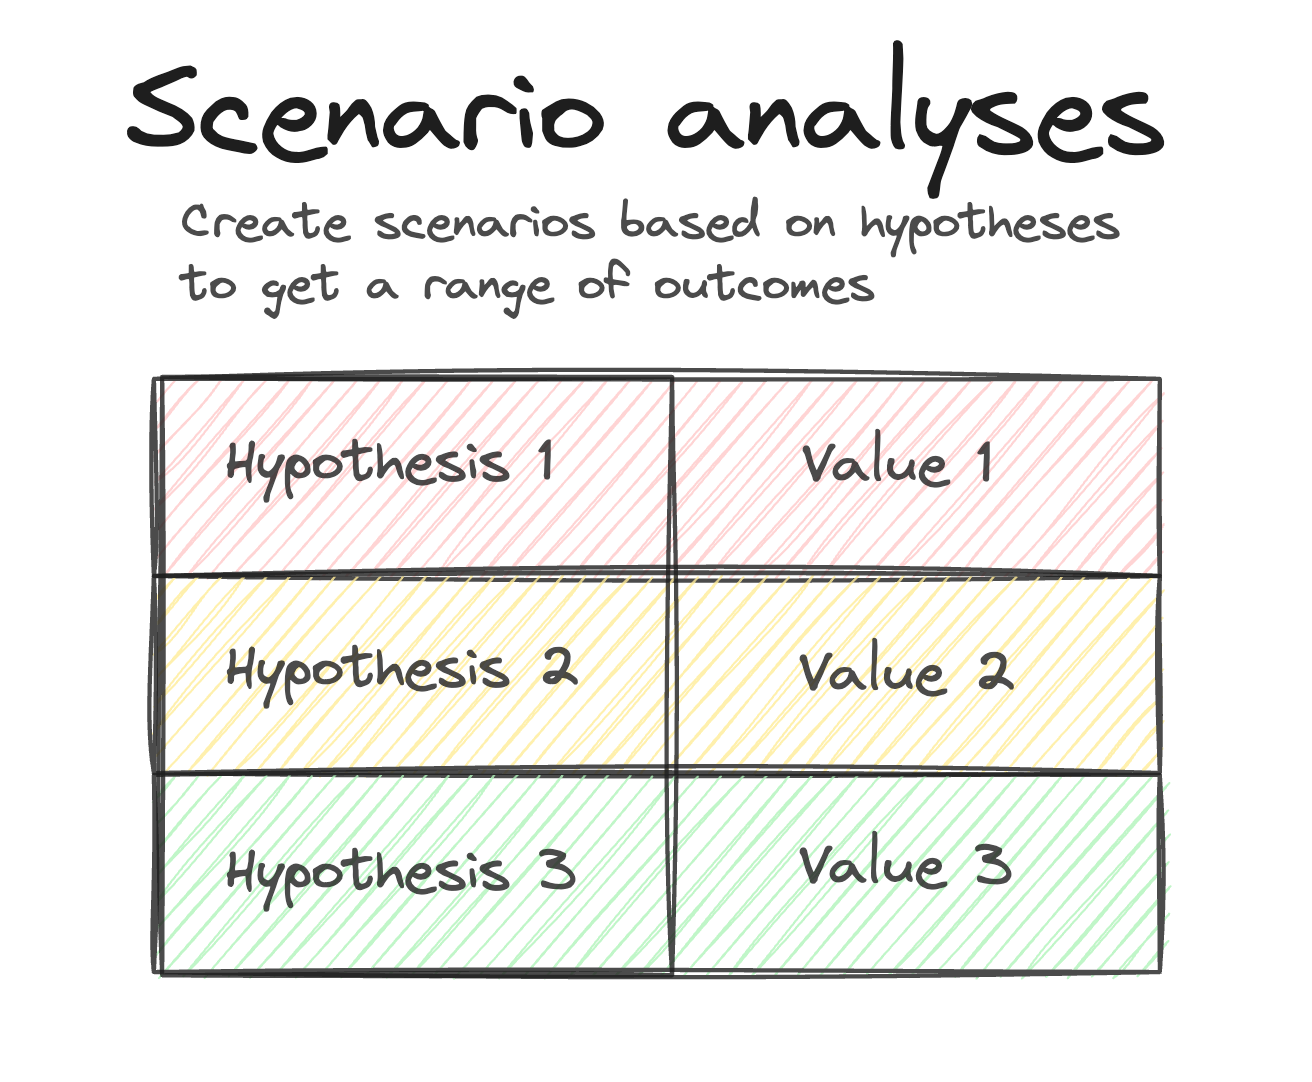
Leverage this sensitivity analysis to create Scenarios (worst/expected/best) based on hypotheses and simulate the expected revenue for each.
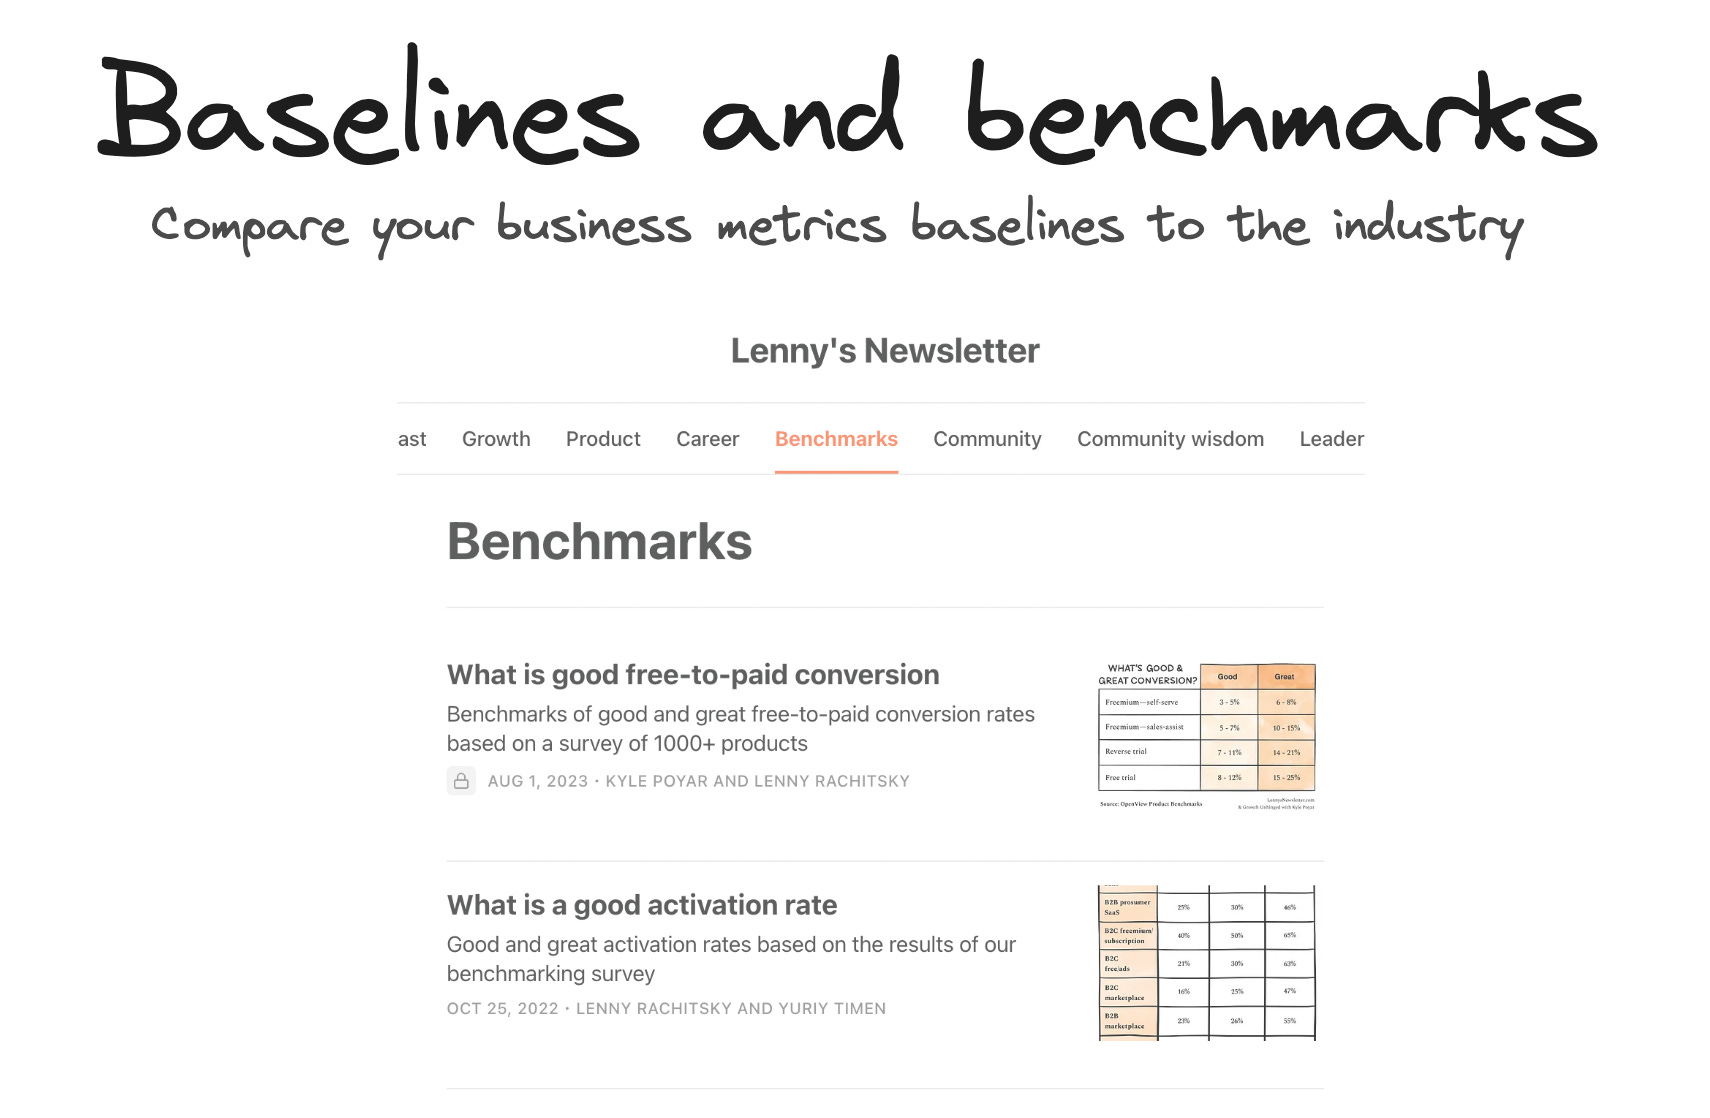
Compare your North Star metric to Benchmarks to get a rough idea of your potential margin of improvement in your industry and context. It shouldn’t guide your decision alone but it is a useful anchor.
How to measure impact
Pre/Post Analysis is a common way to measure the impact of changes but it’s a risk to only rely on them solely. Indeed cohorts before and after the experiment are not necessarily distributed equally and one of them could be impacted by external factors while the other is not (for example Black Friday promotions).
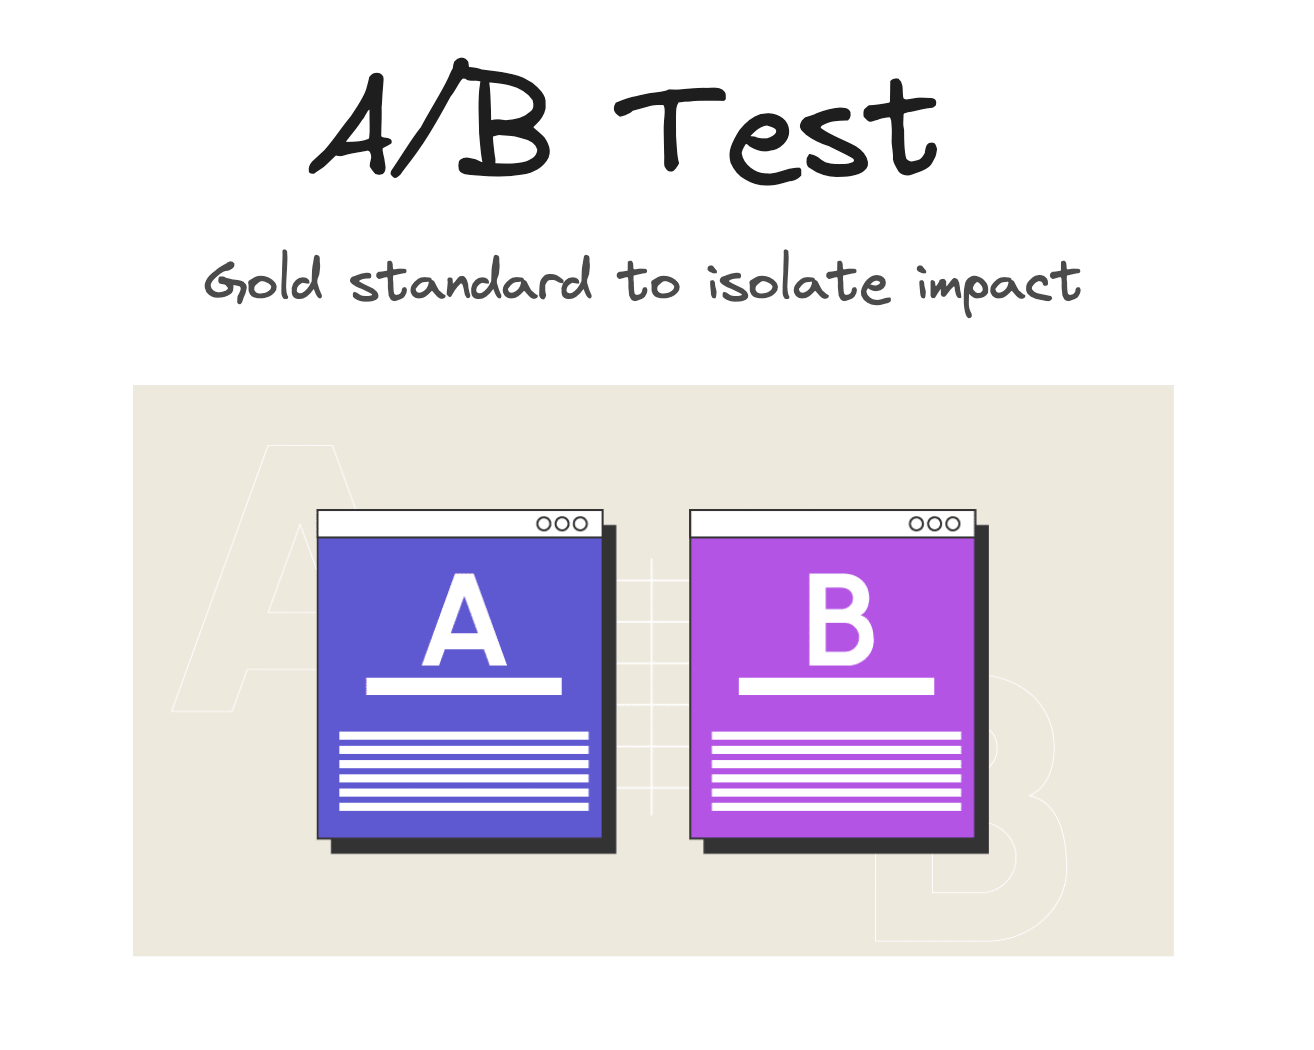
If you have this capability and enough traffic in your product, A/B Testing is the gold standard to isolate impact and compare changes. It removes the bias from a pre/post analysis and let you control the degree of confidence you need to make a decision.
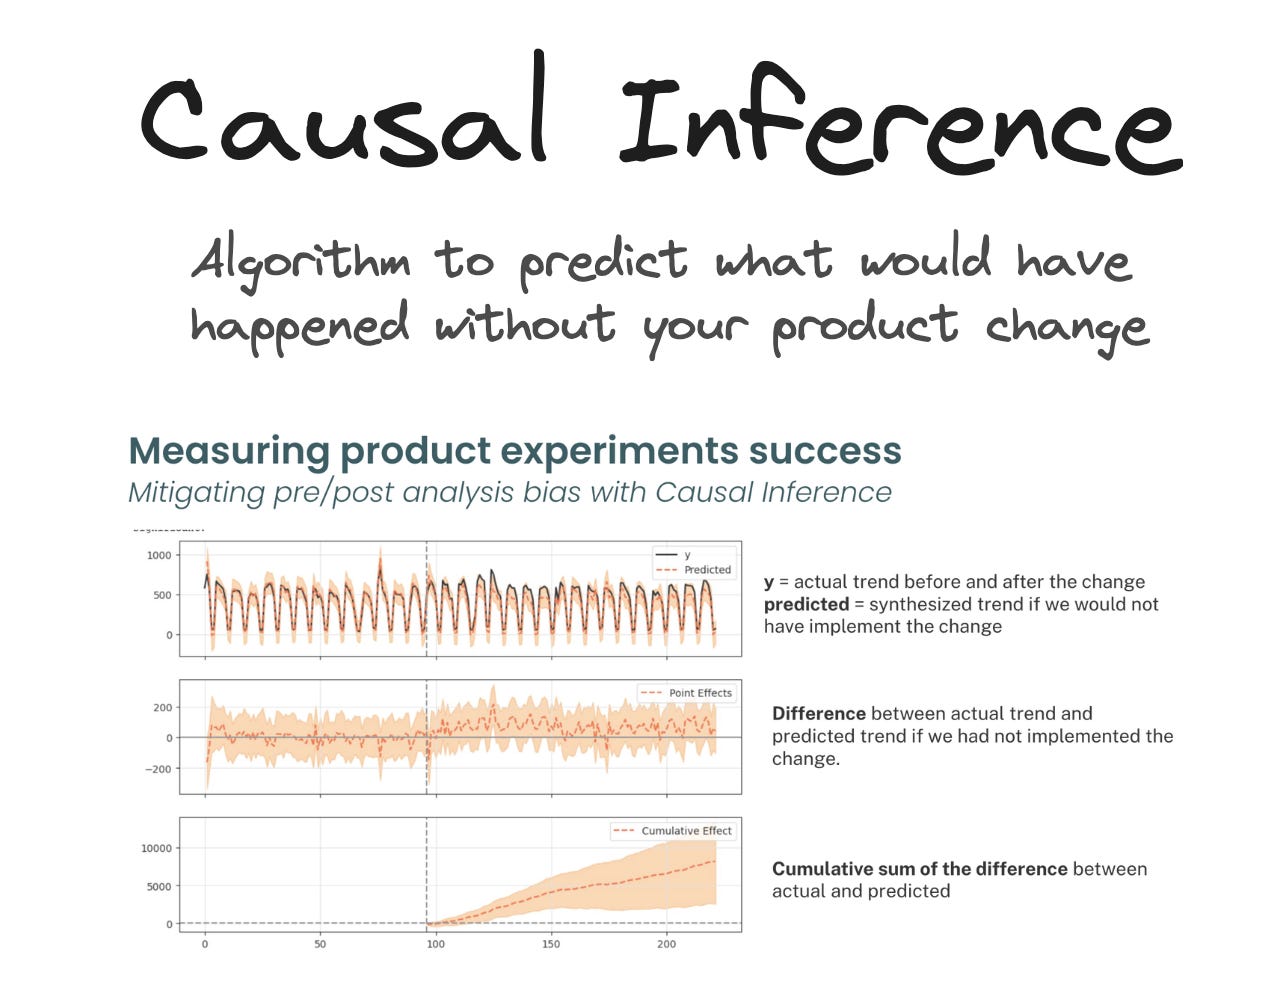
Causal inference is a great method when you can’t perform A/B tests, and better than a simple pre/post analysis. When you release an experiment you don’t know how the metrics would have evolved if you had not released it.
Causal Inference predicts how your metric would have evolved without any change, based on inputs that are correlated. This video is perfect to understand how it works.
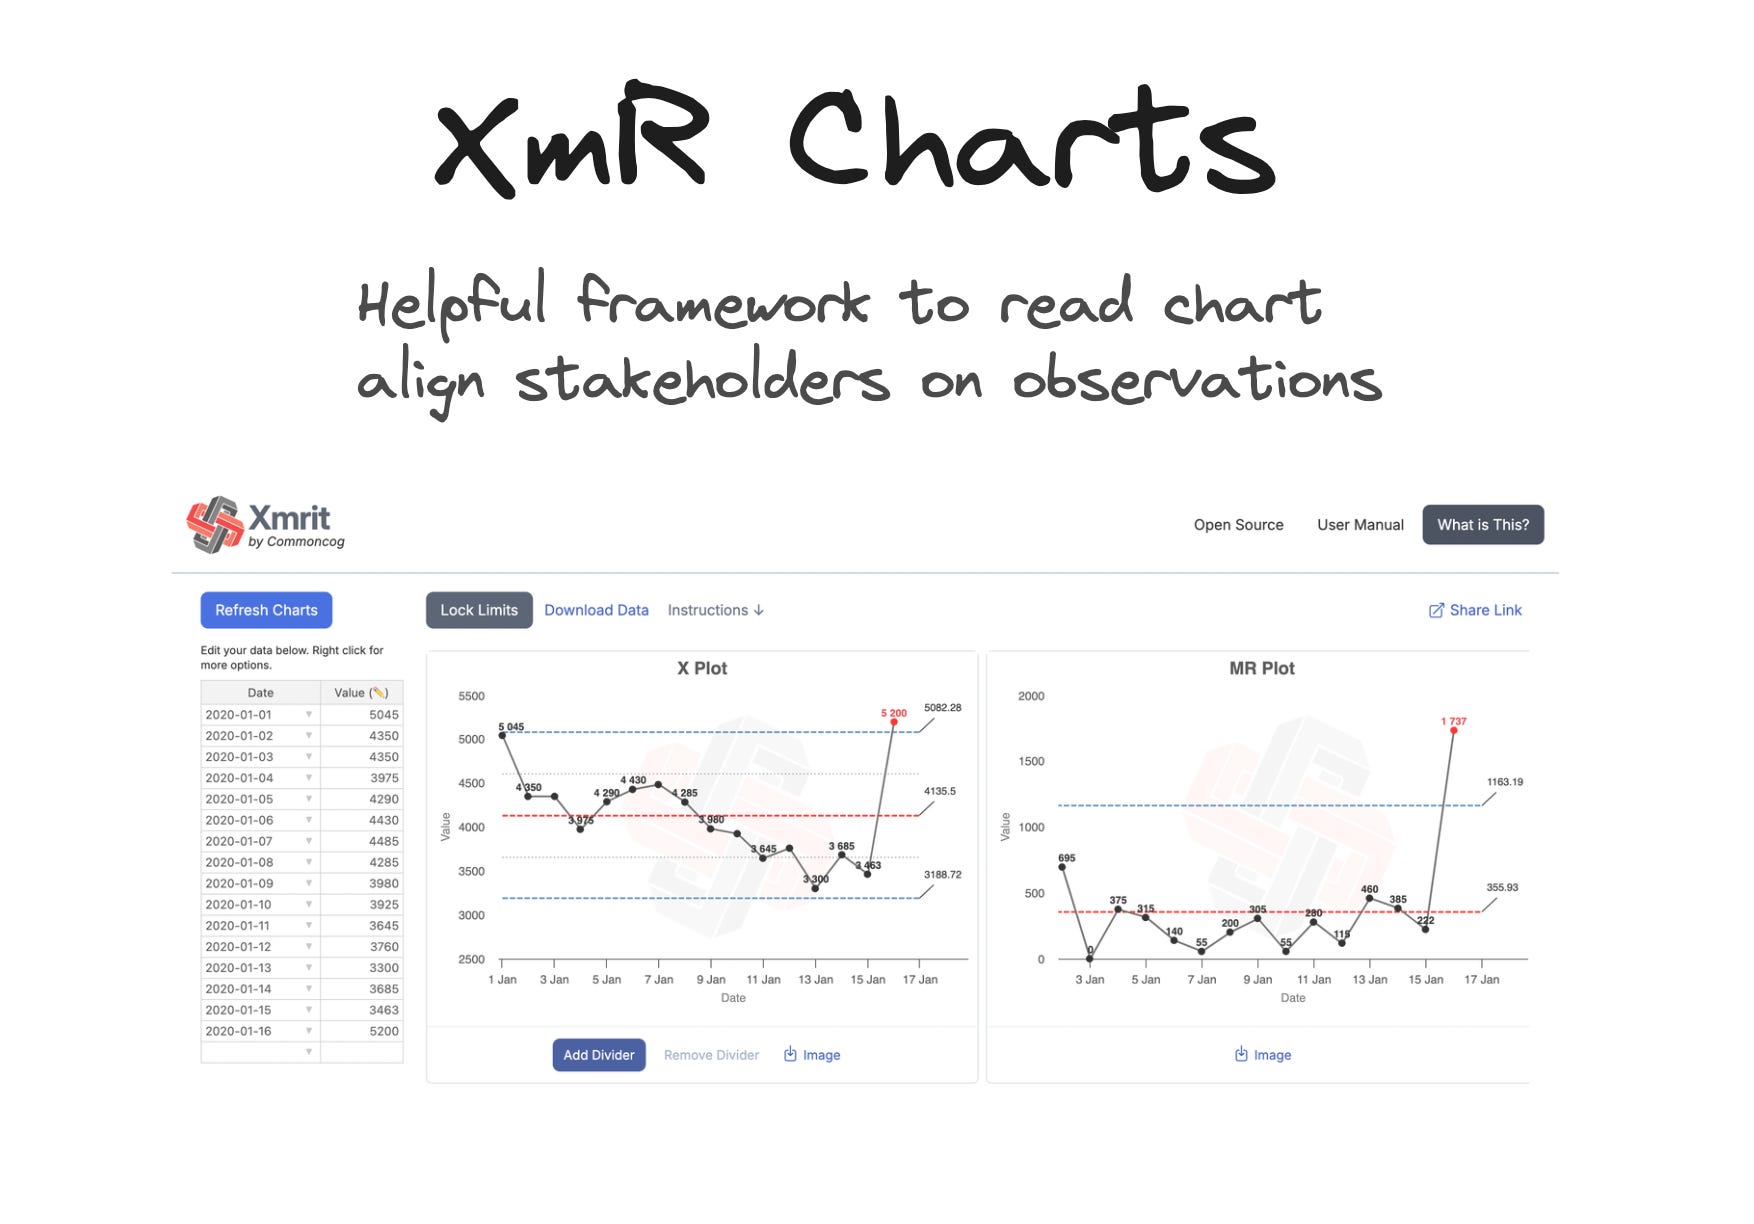
Statistical Process Control with XmR Charts is a useful framework to align stakeholders on metrics variations. It can save you a significant amount of “metric drop investigation” time that are actually false alerts. It helps differentiate noise from actual changes in the system.
Making experimentation work in your company
It’s one thing to build your system, it’s another beast to actually use it and make it work in your company. Some environments are just easier than others and you’ll have to adapt to their specificities (stage of the company, resources, security constraints, tooling, objectives, culture…).
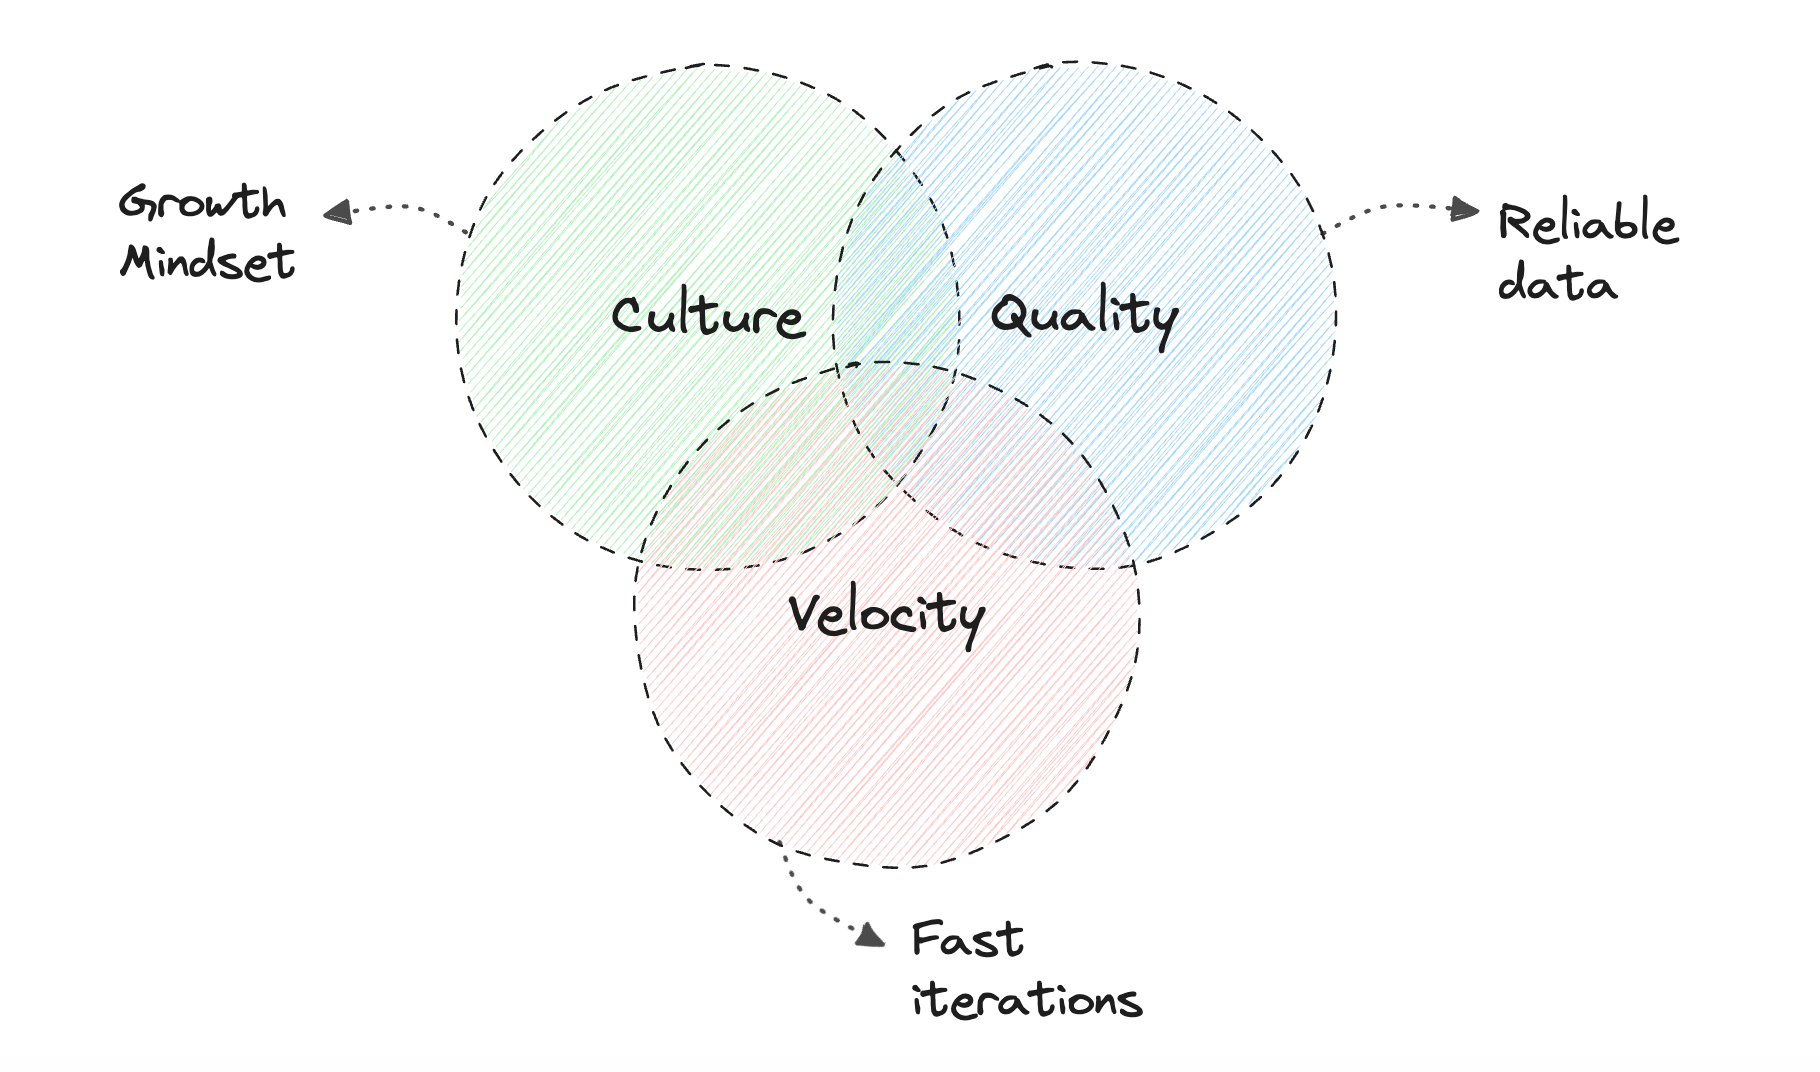
Culture
Leadership should sponsor experimentation efforts and make teams feel safe about trying, failing, learning and iterating towards a goal. They should also set the right vision and strategy to help teams frame objectives in the right context.
Quality
If there are implementation issues or data tracking issues that prevent you from concluding on your hypotheses then you’re wasting time and resources. Quality is about being able to draw conclusions for each experiment to compound learnings.
Velocity
As most experiments fail and success comes from compounding learnings, the key to success and main variable you can influence is the amount of experiments launched. It may require no/low code solutions or high velocity to ship code. Do you have the right processes and infrastructure for this?
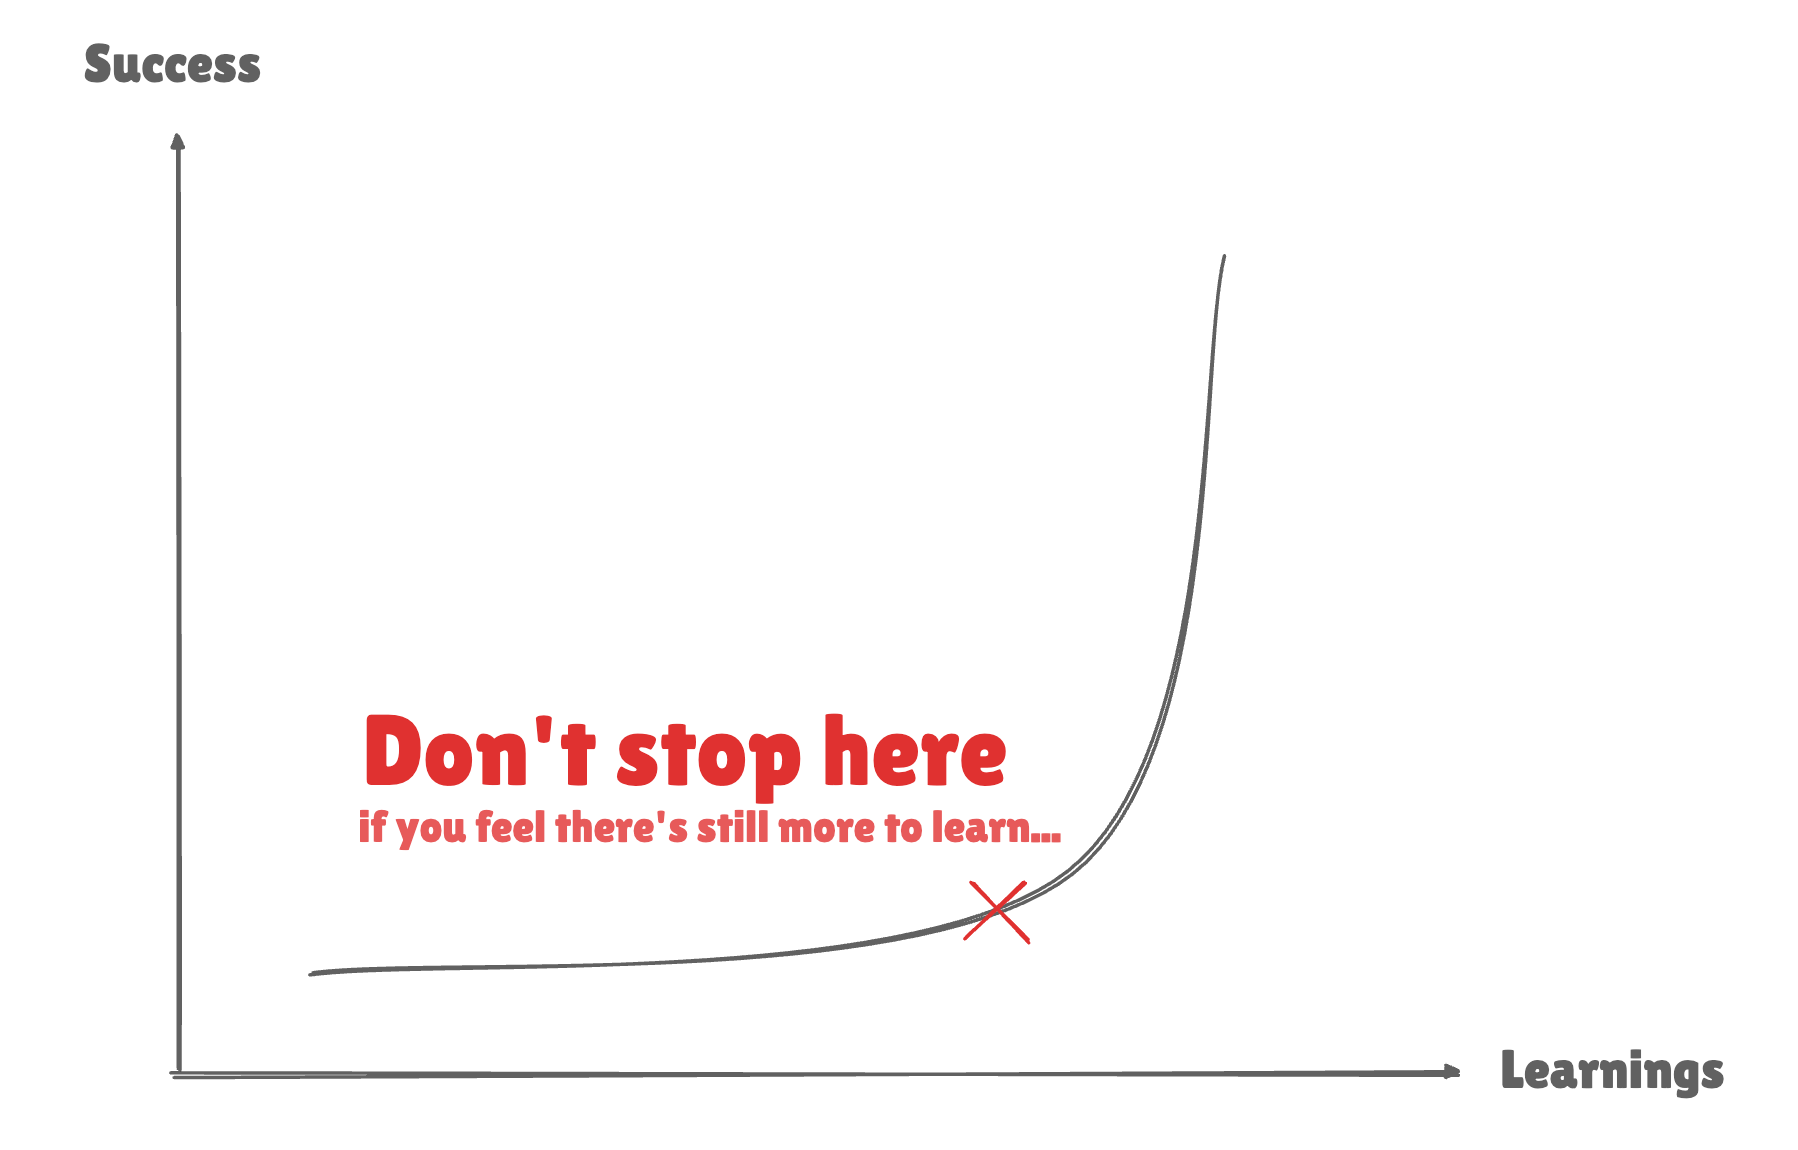
Compound Learnings
Don’t give up too easily on a direction. If you’re still learning new insights at a good pace it may be worth pushing further, sometimes there’s just one piece of the puzzle missing and you may be closer than you think.
This great story from Duolingo shows it.
Share learnings broadly to leverage collective intelligence, share benefits to all teams and identify synergies.
Create a learning base that anyone can access and will fuel your data and insights bucket for further experiments.
Know which game you’re playing. If you want to see big results, implement big changes. If you don’t have Facebook’s traffic you may need to experiment to learn about the right direction for your product and business, opposed to optimizing every inch of your experience such as button’s colors.
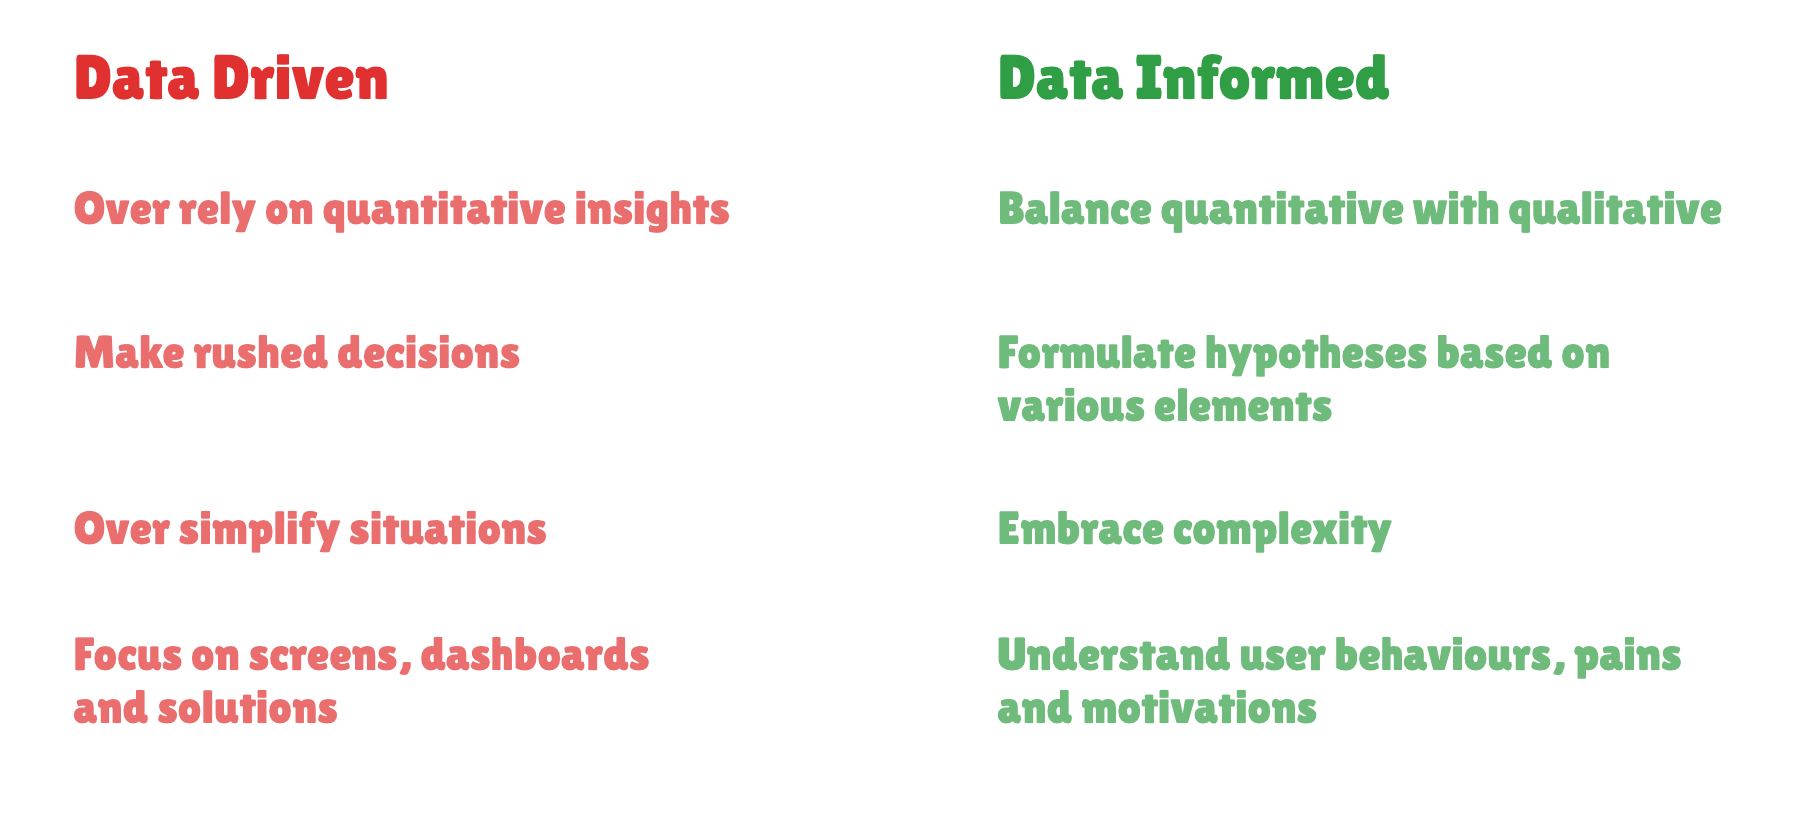
Be data informed, not data driven
Data is an asset and with the right tools and methods you can extract value from it. But data won’t tell you what to do. Data shouldn’t be considered as the one truth to align all different opinions, it is just here to bring evidence and support reasoning.
Data can be high quality or poor quality, it can be framed and interpreted in multiple ways, it’s rather subjective actually.
Besides Data fluency, the key to successful experiment cycles also lies in mastering Product Psychology, researching qualitative insights, understanding the business, having a strong Product and Design sense aligned with industry standards.
It’s also about sharing a vision for the business and the customers that truly motivates you and people around you.
Thanks for following along, I hope it helps. If you’d like to see more content like this or have a chat with me, let’s connect!
Resources to go further
Here are thought leaders and content creators I follow, with resources that helped me in my journey.I hope you find something helpful for you!
Elena Verna leading B2B Growth expert (currently at Dropbox)
Lenny Rachitsky: Leading content creator on Product, Growth, Strategy and Career topics
Leah Tharin: Product and Growth executive for Scaleups
Amplitude resources
Spotify Thoughtful Execution Framework
Harvard Business review
Netflix Research: Experimentation and Causal Inference
Growth Design Case Studies: improve customer journeys ethically by understanding how users behave
Reforge Blog